Which State Is Top In Solar Energy?
The purpose of this article is to determine which U.S. state currently leads in solar energy capacity and production. Solar energy has experienced exponential growth in the United States over the past two decades. According to the Solar Energy Industries Association (SEIA), the solar industry has grown at an average annual rate of 42% over the past decade (Solar Industry Research Data | SEIA). The SEIA projects that over the next decade, total solar capacity will more than quadruple as solar becomes one of the most significant sources of new electricity generation (U.S. Solar Market Insight | SEIA). We will examine various metrics across all 50 states to identify the undisputed leader in installed solar capacity, solar energy generation, solar jobs, and overall solar energy adoption and growth.
Solar Energy Capacity by State
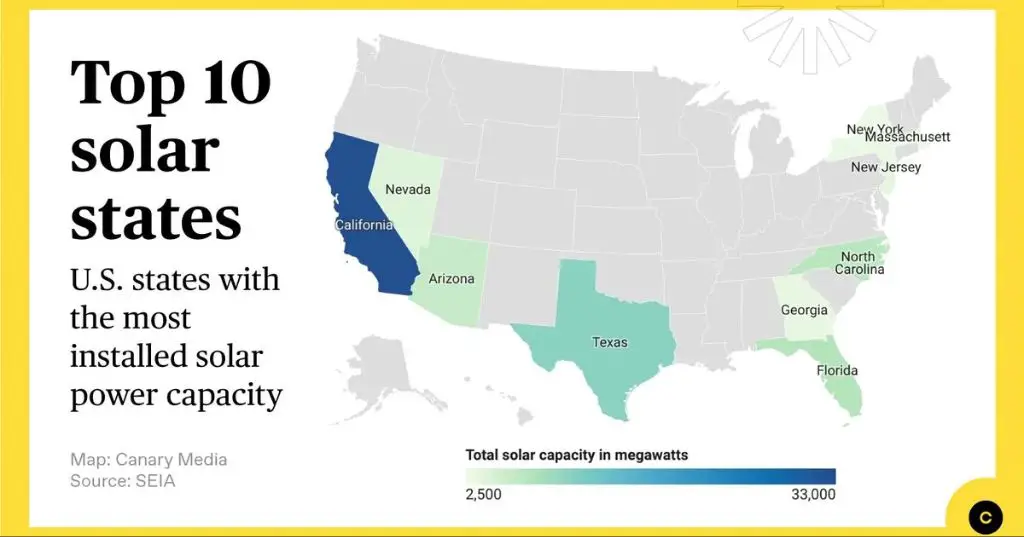
Based on data from the SEIA/GTM Research Solar Market Insight Report, below are the top 10 states by cumulative solar capacity installed as of Q2 2022:
- California – 43,373 MW (source)
- Texas – 13,947 MW
- Florida – 9,054 MW
- North Carolina – 7,316 MW
- Arizona – 6,155 MW
- New Jersey – 4,714 MW
- Massachusetts – 3,708 MW
- Nevada – 3,395 MW
- New York – 2,894 MW
- Utah – 2,724 MW
California leads by a significant margin with over 43 gigawatts of installed solar capacity, well ahead of second-place Texas at nearly 14 gigawatts. In the past 5 years, California has more than doubled its solar capacity from around 20 gigawatts in 2017.
Other states like North Carolina, Arizona, New Jersey, and Massachusetts have also seen rapid growth, with each more than doubling their solar capacity over the same timeframe. The top 10 states now account for over 97 gigawatts of total installed solar capacity.
Solar Energy Generation by State
California leads the nation in total solar electricity generation, producing over 16,000 megawatts (MW) in 2020 according to the Solar Energy Industries Association (SEIA). This accounts for nearly 28% of the total solar generation in the US. California has seen massive growth in solar over the past decade, with generation increasing over 6 times from 2010 to 2020.
Other top states for total solar generation include Nevada, Arizona, North Carolina, and Florida. Nevada generates the second highest amount at over 3,000 MW, accounting for nearly 24% of its total in-state electricity generation (SaveOnEnergy). Its solar generation has grown over 9 times from 2013 to 2020. Arizona, North Carolina, and Florida produce over 2,000 MW each currently.
The growth in solar energy generation across the country has been staggering. According to Choose Energy, the top 10 states for percentage of electricity from solar increased their generation by over 5 times from 2014 to 2020. As solar panel costs continue to decrease and more homes and businesses adopt solar, generation is expected to grow substantially this decade.
Solar Energy Jobs by State
California has been the top state for solar jobs for many years. According to the Solar Energy Industries Association (SEIA), California had 75,712 solar jobs in 2022, accounting for about 30% of the nation’s solar workforce (Forbes). This was an increase of 3.3% from 2021. California has held the #1 position for solar jobs since 2010.
The states with the next highest number of solar jobs are Florida, Texas, New York, and Massachusetts. Florida had 12,562 solar jobs in 2022, up 5% from 2021. Texas had 11,693 jobs, a 7.3% increase. New York had 10,159 jobs, a 14% increase over 2021. Massachusetts had 9,666 solar jobs in 2022 (IRENA).
Other states rounding out the top 10 for solar jobs are New Jersey, Arizona, Nevada, North Carolina, and Colorado. Nationwide, there were over 250,000 solar jobs in 2022, a 7.4% increase from 2021.
Solar Energy Policy
State policies and incentives have played a key role in driving solar energy growth across the United States. According to a 2017 report from the Council on Energy, Environment and Water, the objective of analyzing state solar policies is to find alignment between developer expectations and state incentives to accelerate solar deployment.
Many states have adopted renewable portfolio standards (RPS) which require utilities to source a defined percentage of their electricity from renewable sources. States like California, New Jersey and New York have some of the most ambitious RPS goals ranging from 50-100% renewable energy by 2030-2050. These standards have catalyzed utility-scale solar growth.
Additionally, state solar tax credits and rebates for residential installations have made rooftop solar more affordable. States like Arizona, New York and Massachusetts offer generous incentives that offset 30-40% of rooftop solar system costs. Streamlined solar permitting and net metering policies also enable growth.
State governments play an integral role in solar adoption by setting RPS requirements, offering financial incentives, and creating favorable market conditions through policy. Analysing the convergence of state policies and solar developer needs allows states to optimize their approach.
Residential Solar Adoption
When it comes to residential solar adoption, California leads the way with over 1.1 million homes powered by solar panels as of 2021, according to the Solar Energy Industries Association (State-By-State Map | SEIA). This amounts to over 15% of households in the state having rooftop solar installations. Other top states for residential solar include Arizona with over 338,000 homes powered by solar and New Jersey with over 201,000 solar homes.
Some key factors driving residential solar adoption rates include electricity prices, solar incentives and policies, and amount of sunshine. California has high electricity rates along with a strong net metering policy that makes going solar attractive financially. Sunny states like Arizona also see high solar adoption thanks to abundant solar resources. Top solar states tend to have strong solar incentives, renewable portfolio standards, and interconnection policies to encourage rooftop solar growth.
Utility-Scale Solar Projects
Some of the largest solar farms in the United States are located in California, which has ample sunlight and supportive policies for renewable energy development. The Solar Star project in Kern and Los Angeles counties has a capacity of 579 megawatts, making it the largest completed solar farm in the country (https://8billiontrees.com/solar-panels/largest-solar-farm/). The Topaz Solar Farm in San Luis Obispo County ranks as the second largest at 550 megawatts (https://www.solarfeeds.com/mag/solar-farms-in-the-usa/). Other major projects in California include the Ivanpah Solar Electric Generating System in Clark Mountain (392 MW) and the Desert Sunlight Solar Farm in Riverside County (550 MW).
Texas also boasts some of the country’s largest solar farms, including the Longdraw Solar Park in Borden County (307 MW), the Lapetus Solar Project in Andrews County (300 MW), and the Phoebe Solar Project in Winkler County (250 MW). These massive projects demonstrate how California and Texas are leaders in building utility-scale solar to meet electricity demand.
Solar Manufacturing by State
California is the top state for solar manufacturing, home to major solar companies like SunPower, Solaria, and Suniva. The state produces 43% of domestically manufactured PV cells and modules, according to the Solar Energy Industry Association (SEIA).
Other leading solar manufacturing states include Oregon, Texas, Michigan, and Arizona. Oregon has become a hub for PV manufacturing thanks to companies like SolarWorld. Texas has attracted big solar manufacturers like Mission Solar and JinkoSolar. Major solar manufacturing facilities are located in Michigan and Arizona as well.
The growth of solar manufacturing is creating thousands of jobs and bringing large clean energy investments into these states. However, the US solar manufacturing industry faces tough competition from low-cost imports from countries like China. Efforts are underway to strengthen domestic solar manufacturing through programs like the Solar Energy Manufacturing for America initiative.
In summary, California dominates as the top solar manufacturing state, but other states like Oregon, Texas, Michigan and Arizona also have sizable PV production capacities and are vying to grow their market share of this rapidly expanding industry.
Source: https://www.seia.org/sites/default/files/2021-06/California-Solar-Factsheet-2021.pdf
Challenges Facing Top Solar States
Many of the top solar states face challenges in fully realizing their solar potential and reaching renewable energy goals. For example, according to Cloudy Prospects: Why Solar Energy Struggles in These 5 States, some states like Florida have policies that hold back solar growth. The state has not enacted favorable policies like renewable portfolio standards to drive adoption of solar power (Cloudy Prospects: Why Solar Energy Struggles in These 5 States).
Other top solar states like California struggle with integrating large amounts of solar onto the electric grid. As quoted from States with Untapped Solar Markets, “California has been a leader in solar energy adoption, but its aging transmission infrastructure has trouble integrating large utility-scale projects” (States with Untapped Solar Markets). Upgrading transmission lines is critical for top solar states to handle more renewable power.
Fights over net metering policies also hamper growth in leading states. For instance, States with Untapped Solar Markets notes that “Nevada has gone back and forth on net metering regulations in recent years, creating uncertainty for the residential solar market.” Battles between utilities and solar companies over net metering continue in states like California and Arizona as well. Solving grid integration and net metering issues remains vital for solar leaders.
The Leader in Solar Energy
A review of solar capacity, generation, jobs, policy, and adoption shows that California is the clear leader in solar energy in the United States. The Golden State has been at the forefront of solar adoption for decades and continues to lead the way in almost every category related to solar energy.
California generates over 20% of the nation’s solar electricity. With over 22,000 megawatts of installed solar capacity, California has more solar capacity than every other state combined. The state also leads in solar jobs with over 76,000 employed in the solar industry. In addition, California accounts for 40% of the nation’s residential solar adoption, with over 1.3 million homes powered by the sun.
The state has pioneered strong solar policies, like the California Solar Initiative, that have driven growth in residential and utility-scale projects. Major solar manufacturers and developers are headquartered in California due to strong state incentives. While California faces challenges from intermittent wildfires and blackouts, it continues to lead the transition to solar across the U.S.