Where Is The Solar Energy Potential The Greatest In The Us?
The American Southwest, particularly California, Arizona, Utah, Nevada and New Mexico, has the greatest solar energy potential in the United States. This region receives the most irradiation from the sun and has vast amounts of available, undeveloped land that is optimal for utility-scale solar installations. Additional factors that contribute to the solar potential include high electricity prices, favorable solar incentives and policies, and an existing solar workforce. This article examines the key determinants of solar energy potential and makes the case for why the Southwest is primed to lead America’s transition to solar power.
Solar Irradiation
Solar irradiation, also known as insolation, refers to the amount of solar energy received at a location on the earth’s surface. It is measured in kilowatt-hours per square meter (kWh/m2). Solar irradiation varies widely across the United States based on latitude, altitude, and local weather patterns.
According to data from the National Renewable Energy Laboratory (NREL), the Southwestern states in the U.S. receive the highest levels of solar irradiation. This includes states like Arizona, New Mexico, Nevada, and California. For example, parts of the Mojave Desert in California average around 7 kWh/m2 per day. Other areas with high solar potential include West Texas, southern Colorado, and western Kansas which all average over 5 kWh/m2 per day.
The states with the lowest solar potential include northern tier states like Maine, Washington, Alaska, and North Dakota which receive less than 4 kWh/m2 per day on average. Coastal areas also tend to have less solar potential due to cloud cover.
So in summary, the Southwest region of the U.S. centered on Arizona and New Mexico has the greatest solar energy potential based on having the highest levels of solar irradiation.
Land Availability
When evaluating the potential for solar energy in each state, the amount of available land area is a key consideration. Large-scale solar farms require significant acreage, so states with an ample supply of open, undeveloped land generally offer greater solar energy potential. Based on total land area, western states like California, Nevada, Arizona, and New Mexico have the most available space for solar installations. However, even smaller states can still accommodate large solar farms if the land is properly zoned and permitted. For example, states like Massachusetts and New Jersey have supported the development of sizable solar arrays despite their relatively limited size. Ultimately, land availability is just one factor among many that determines a state’s solar energy prospects. With thoughtful land-use planning and cooperation between solar developers and local communities, solar power can thrive even in densely populated parts of the country.
Population Density
Population density refers to the number of people living in a defined geographic area. Areas with higher population densities have more people concentrated per square mile or square kilometer. Areas with lower densities have fewer people spread across a wider area.
When it comes to solar energy potential, population density is an important factor to consider. Less densely populated areas generally have more available land to install large-scale solar farms. According to the U.S. Census Bureau, the states with the lowest population densities are Alaska, Wyoming, Montana, South Dakota, North Dakota, and New Mexico. These western states have large swaths of rural land suitable for utility-scale solar installations.
However, higher population densities also create more demand for electricity. The most densely populated states like New Jersey, Rhode Island, and Massachusetts can still benefit greatly from distributed solar energy on homes and businesses. Rooftop solar arrays generate clean power where it’s needed most.
An ideal population density for solar appears to fall somewhere in the middle – not too sparsely populated but also not crammed full of people and buildings. States with moderately high densities like California, Utah, Colorado, and Texas currently lead the nation in total installed solar capacity. With a mix of open spaces and populous cities, these states can take advantage of both utility-scale and distributed solar generation.
Electricity Prices
The costs of electricity vary widely across the United States, with some states having average retail prices nearly double that of other states. These price differences are driven by factors like the types of power plants, transmission constraints, state regulations, and weather influences on demand.
High electricity prices typically create strong incentives for households and businesses to adopt rooftop solar panels in order to reduce their monthly utility bills. The savings from solar energy can make the return on investment much faster in states with expensive grid power.
Some of the states with the highest average retail electricity rates include Hawaii (34.54¢/kWh), Alaska (22.26¢/kWh), Connecticut (22.19¢/kWh), Massachusetts (21.82¢/kWh), and California (21.07¢/kWh). Not surprisingly, many of these states also rank highly in total installed solar capacity, like California which leads the nation by far.
So regions with higher-than-average electricity prices often present very promising solar markets, where demand for residential and commercial solar installations will continue rising given the potential bill savings.
Solar Incentives
Many states have implemented solar incentives in order to encourage their residents and businesses to go solar. These incentives come in the form of rebates, tax credits, renewable energy credits, net metering programs, and other policies aimed at lowering the upfront costs of solar panel installations and improving the return on investment.
These incentives have proven extremely effective in catalyzing solar energy growth. In states with generous and stable solar incentives, the market has expanded rapidly as homeowners and commercial property owners take advantage of the savings. Top states for solar growth like California, New Jersey, and Massachusetts have implemented strong incentive programs.
Some of the most impactful incentives include performance-based incentives that pay based on the amount of solar electricity generated, as well as property tax exemptions. The federal Investment Tax Credit, which allows taxpayers to deduct 30% of the cost of a solar installation from their federal taxes, has also played a major role in solar growth nationally.
The Sunshine State of Florida has no personal or corporate income tax, making tax credits less effective. But the state still offers strong incentives like sales tax exemptions, property tax exemptions, and net metering policies to help make solar affordable and attractive.
Current Solar Capacity
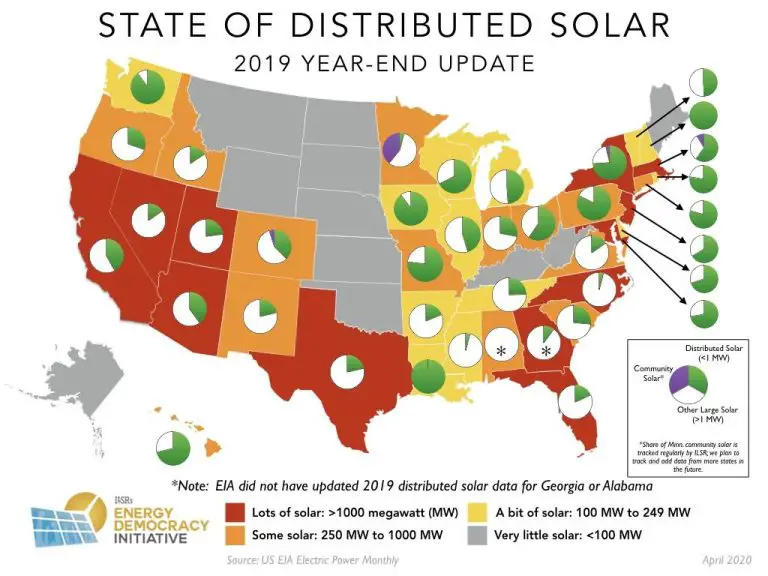
California currently leads the nation in installed solar capacity, with over 30,000 megawatts of solar power across more than 1 million solar installations statewide. Other leading states include Arizona, Nevada, New Jersey, New York, Texas, Massachusetts, and North Carolina.
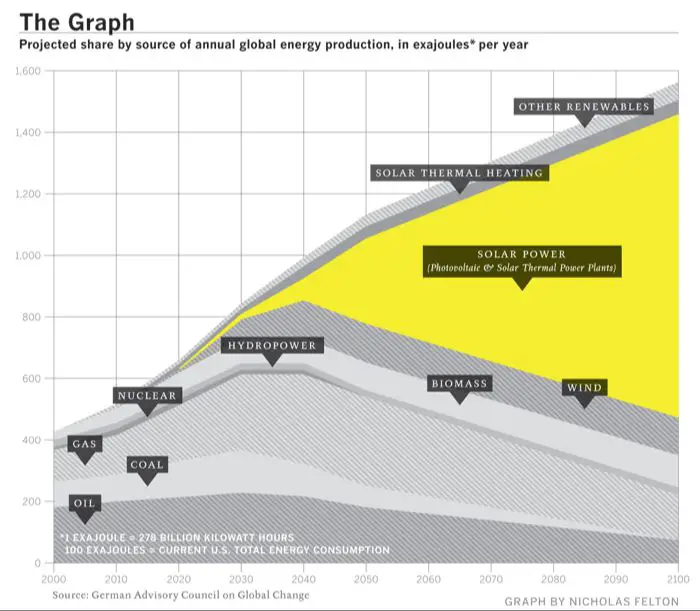
Solar capacity has grown exponentially across the U.S. in the past decade. Annual installations have increased from less than 1,000 megawatts in 2009 to over 15,000 megawatts in 2021. Many experts predict continued rapid growth, with over 100,000 megawatts of total solar capacity expected by 2030.
Behind California, the states with the most installed solar capacity include Texas, Arizona, North Carolina, New Jersey, Nevada, New York, Florida, Massachusetts, and Pennsylvania. However, when accounting for population size, states with the most solar per resident include Nevada, Arizona, Hawaii, New Jersey, California, New Mexico, Vermont, Massachusetts, Utah, and Maryland.
Solar Jobs
The solar industry has been a major driver of job growth in the United States over the past decade. According to the Solar Foundation’s National Solar Jobs Census, over 250,000 Americans work in solar – an increase of over 150% since 2010. The states with the most solar jobs are:
California – California leads the nation with over 76,000 solar jobs as of 2018. Major urban areas like Los Angeles, San Diego and San Francisco have thriving solar markets and companies. California’s abundant sunshine, high energy prices and state incentives have helped create the most solar jobs of any state.
Massachusetts – Massachusetts has over 11,500 solar jobs, the 2nd most of any state, driven by strong state solar policies like the Solar Renewable Energy Certificate (SREC) program. The Boston metro area accounts for the majority of the state’s solar jobs.
New York – New York has approximately 9,000 solar jobs. Growth has been driven by initiatives like the NY-Sun megawatt block program and utility-administered solar incentive programs. The New York City metro area is home to the most solar jobs.
The solar industry is projected to continue strong job growth over the next decade as costs fall and solar deployment rises. According to the Solar Foundation, nationwide solar jobs could reach over 400,000 by 2029, representing a growth of 63%. States with abundant solar resources and supportive policies are positioned to benefit the most from future job creation.
Regulatory Environment
The regulatory environment for solar energy varies greatly across the United States. Some states have implemented strong policies, incentives, and regulations to promote solar energy growth, while others lag behind.
California and New Jersey stand out with the most solar-friendly policies in the nation. Both states have renewable portfolio standards that require utilities to source a minimum percentage of their electricity from renewable sources. Additionally, they offer robust statewide rebate programs for residential and commercial solar installations. Net metering policies enable solar panel owners to receive credit for excess electricity sent back to the grid. Streamlined permitting processes reduce red tape for solar projects as well.
Massachusetts, New York, and Oregon rank among the top solar states as well due to Renewable Portfolio Standards, net metering, and solar incentives. Nearly 30 states around the country now have an RPS in place.
On the other end of the spectrum, fossil fuel-rich states like West Virginia, Wyoming, and Louisiana have minimal solar incentives and lack a statewide RPS. Coal, oil and natural gas interests have slowed solar progress in these locations.
Overall, states with abundant sunshine as well as strong clean energy policies and financial incentives foster the greatest solar energy growth. Supportive regulatory environments lower costs and remove obstacles for residents, businesses, and utilities to “go solar” and tap into this renewable resource.
Conclusion
In summary, the key factors that determine solar energy potential in different states across the US include solar irradiation levels, available vacant land, electricity prices, existing incentives, and regulatory policies. Based on an analysis of these factors, the states with the greatest potential for solar energy development are:
- California – Has abundant sunshine, high electricity prices, strong solar incentives, and a supportive regulatory environment.
- Nevada – Receives plentiful solar irradiation and has ample open land while also having supportive policies.
- Arizona – Gets high levels of sunshine and has policies favorable to solar, though does have some land constraints.
- Texas – Benefits from high solar resources and land availability, though electricity prices are lower.
- New Mexico – Excellent solar irradiation and vacant land but currently lacks strong policies to incentivize solar.
With the right supportive policies, incentives, and initiatives, solar energy could continue expanding and meet a significant portion of electricity demand across these high-potential states and the country as a whole.