Is Wind Or Solar Cheaper?
Introduction
With the increasing urgency of climate change and the falling costs of renewable energy, many countries around the world are rapidly transitioning their electricity grids to sustainable sources like wind and solar power. But as investments pour into building more wind farms and solar arrays, an important question arises: which of these renewable energy sources is cheaper?
Both wind and solar power have seen dramatic decreases in costs over the past decade. But they each have their own advantages and disadvantages when it comes to overall price. Understanding the upfront and ongoing costs of wind versus solar can help guide energy policy and investments to build out renewable capacity in the most economical way.
This article examines the full costs of generating electricity from wind and solar, including capacity factors, land usage, storage needs, location impacts, and recent cost trends. By comparing current pricing and projections for these two key renewable energy sources, we can better evaluate the economic argument between wind and solar.
Upfront Costs
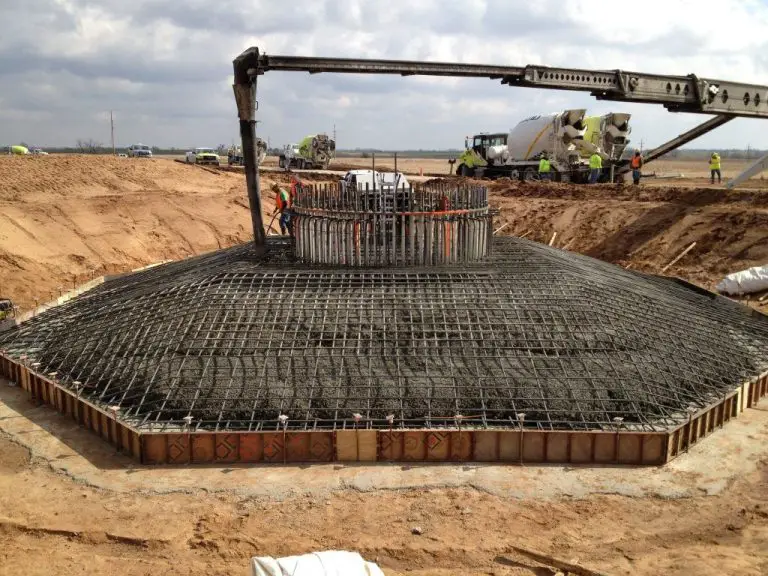
The upfront costs for wind and solar power include the installation and the equipment costs. For residential wind turbines, the average cost ranges from $15,000 to $30,000 depending on the size and capacity. Larger commercial wind turbines can cost over $65,000 installed. In comparison, the average cost nationally for a professionally installed residential solar panel system is about $8,000 to $9,000.
According to this source, small residential wind turbines cost $3,000 to $5,000 per kilowatt of power capacity. On the lower end, a 5 kW turbine would cost $15,000. On the higher end, a 10 kW turbine would cost $50,000. Larger commercial wind turbines over 100 kW can cost over $1 million.
For solar power, the main equipment costs are the solar panels and inverter. The average solar panel system size for a home is about 5-8 kW. At a cost of $2 to $4 per watt for solar panels, plus $0.20 to $0.70 per watt for the inverter, a full solar system for a home runs $8,000 to $16,000 before installation.
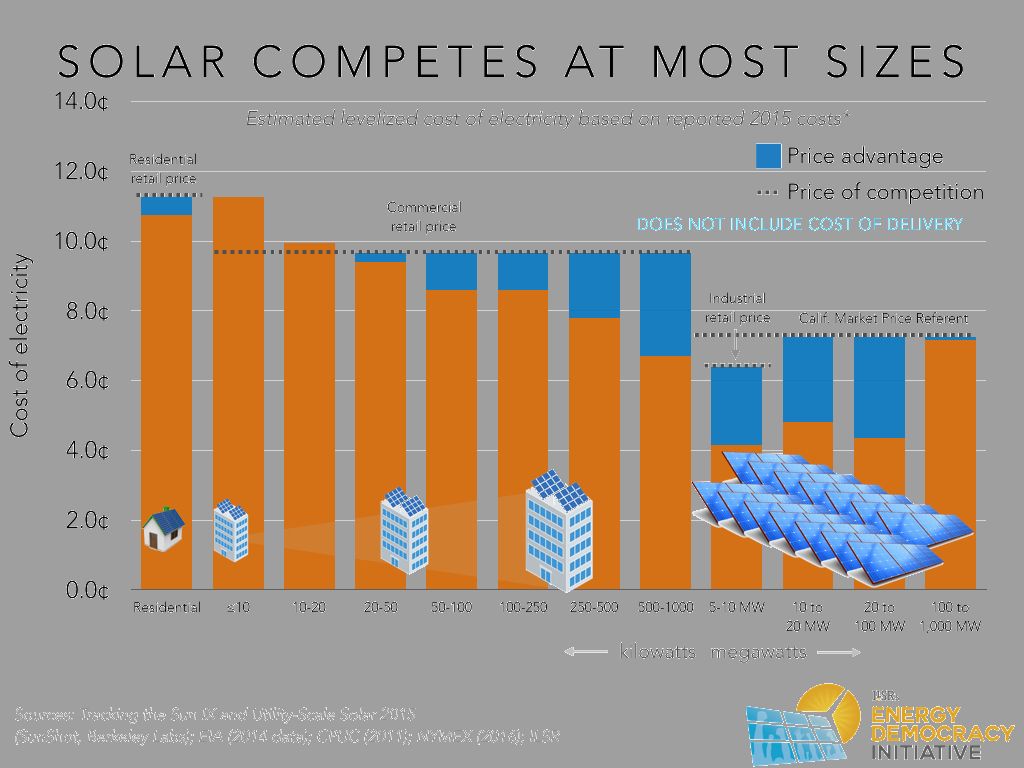
In summary, solar power systems tend to have lower upfront equipment and installation costs compared to small wind turbines for residential use. But for large commercial installations, wind turbines can potentially beat the upfront costs of comparably sized solar farms.
Ongoing Costs
The ongoing costs of wind and solar power include maintenance and operational expenses. For wind power, routine maintenance costs are estimated at around $25/kW-year, with total operating costs averaging $40/kW-year or 1-2c/kWh according to Wind power operating costs. Major maintenance is needed around every 5 years. According to Operation and maintenance costs of wind generated power, operation and maintenance costs can account for 20-25% of the total levelized cost of wind energy.
For solar PV systems, there are practically no ongoing fuel costs but regular maintenance is required, such as cleaning panels, checking electrical systems, and trimming vegetation. Annual operating and maintenance costs range from 1-1.5c/kWh for utility-scale solar, with routine maintenance around $20-30/kW-year according to NREL. Inverter replacement may be needed after 10-15 years. Overall, solar PV has very low maintenance and operating costs compared to other energy sources.
Capacity Factors
The capacity factor is a measure of how much energy a power plant actually produces compared to its maximum possible output over a period of time. It is calculated by taking the total energy generated divided by the maximum possible output if the plant was running at full capacity for the entire time period.
Capacity factors have a major impact on the actual cost per unit of energy produced. Solar photovoltaic (PV) typically has a lower capacity factor than wind. According to the U.S. Energy Information Administration, the average capacity factor for utility-scale solar PV plants ranges from 15% to 38%, depending on the tracking capabilities and geographic location [1]. In comparison, wind farms generally have capacity factors between 25% to 45% [2]. This means wind turbines produce more actual energy output from the same amount of installed capacity.
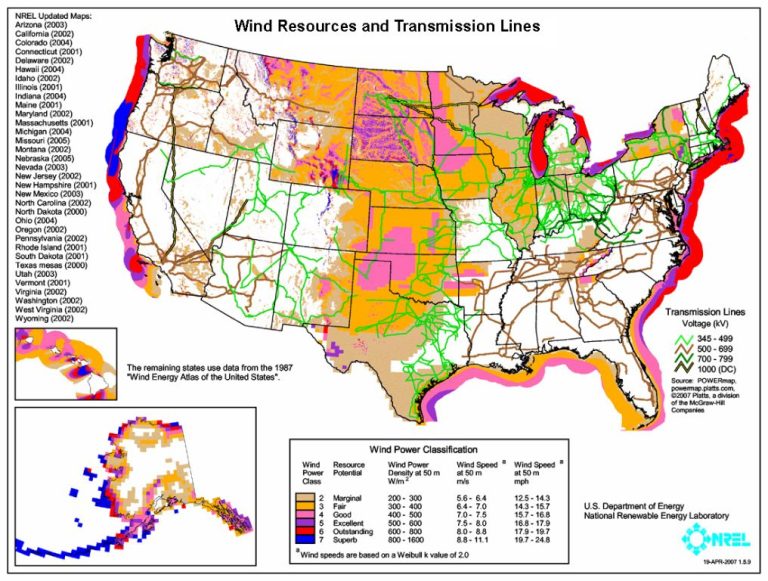
The capacity factor difference is partly due to the intermittent nature of solar, which only generates power when the sun is shining. In contrast, wind can generate power at all hours as long as the wind is blowing. Location also plays a major role. Solar capacity factors are higher in sunnier southern regions like California and Texas. Meanwhile, wind capacity factors are higher in windier plains or offshore sites [3].
Due to the lower capacity factors, solar requires more installed capacity than wind to generate the same amount of energy over time. This drives up the costs per unit of energy produced from solar versus wind power.
Land Usage
Wind and solar power require significantly more land area per unit of energy produced compared to fossil fuels or nuclear power. According to an analysis from the Brookings Institution [1], wind farms require 360 times more land area per megawatt-hour (MWh) than a natural gas or coal plant. Solar photovoltaic plants require 75 times more land per MWh.
This is because wind and solar are less energy dense – they cannot produce as much energy from a given area of land compared to fossil fuels. Fossil fuel plants concentrate energy in the fuel, while wind and solar rely on dilute energy flows across large areas. For example, generating 1,000 megawatts of power would require 32,000 acres for wind turbines or 11,000 acres for solar panels, but only 230 acres for a natural gas plant [2].
However, it’s important to note that wind and solar projects can co-exist with other land uses like farming or grazing. Only 2-5% of the total land area is occupied by turbines or panels, allowing productive use of the remaining 95-98% [3]. So while wind and solar require more total land, the actual footprint can be minimized.
Storage Needs
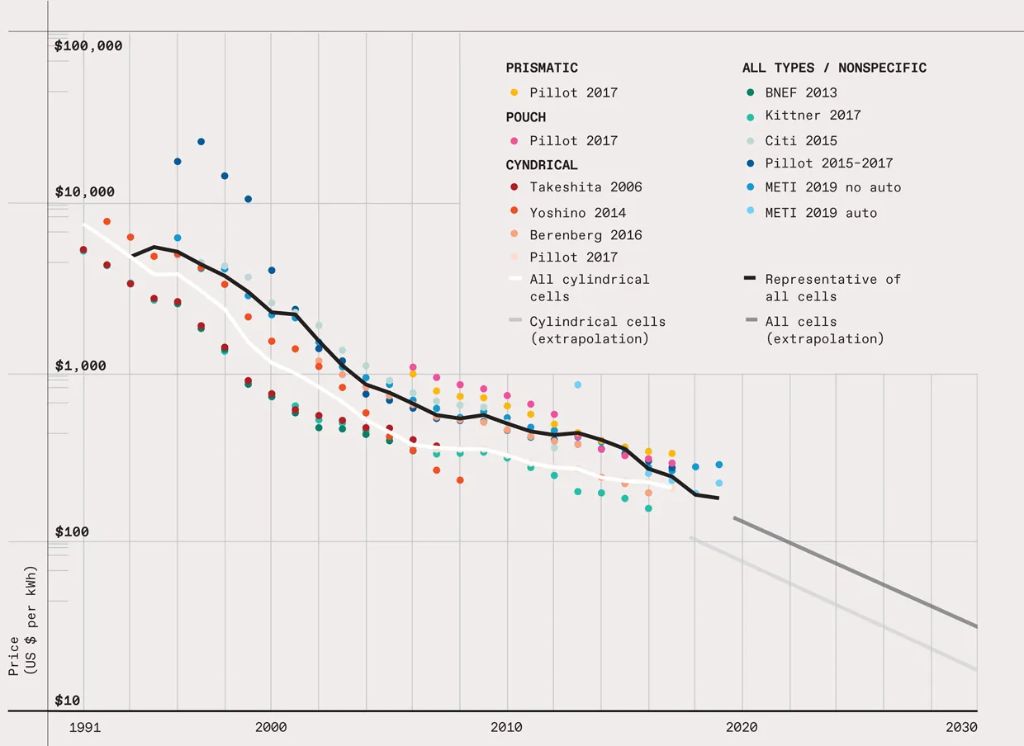
The intermittent nature of wind and solar power means that storage is often needed to provide reliable electricity. Lithium-ion batteries have become the dominant form of grid-scale storage due to rapid cost declines over the past decade. According to a 2021 report by the National Renewable Energy Laboratory, costs for 4-hour utility-scale lithium-ion storage have fallen from $1,000/kWh in 2012 to around $150/kWh in 2021 (NREL). Further cost reductions to around $100/kWh are expected by 2030.
To reach high renewable energy penetrations, storage capacity on the scale of days or even weeks is needed. According to an analysis by Vox, storage costs must fall to around $20/kWh for renewables plus storage to beat the cost of fossil fuel alternatives (Vox). While costs are dropping quickly, storage remains a key economic consideration when comparing wind and solar.
Location Impacts
The cost of wind and solar power can vary significantly depending on location. This is because the amount of sunlight and wind speed impacts how much energy can be generated. According to a report, solar power costs tend to be lowest in the sunny Southwest U.S. states like Arizona, where capacity factors can reach over 27%. In contrast, solar power in Midwest states may have capacity factors under 20%, making the cost per kilowatt-hour higher.
For wind power, the windiest areas like the Great Plains and coastal regions have much lower costs than less windy areas. Wind capacity factors in the best locations can exceed 45%, while locations with poorer wind resources may be under 30%. Since the wind turbines and solar panels account for a large portion of the overall costs, having higher capacity factors directly translates into lower costs per kilowatt-hour of generation. Therefore, choosing sites with strong solar or wind resources is crucial for minimizing the costs of these renewable sources.
Subsidies
Both wind and solar power have benefited from substantial government subsidies in the United States. According to a report from the Energy Information Administration, federal renewable energy subsidies jumped to $15.6 billion in fiscal year 2022, up from $7.4 billion in 2016. The vast majority of these subsidies have gone to wind and solar energy projects.
Specifically, wind and solar combined received 94% of federal renewable electricity subsidies in FY 2022, despite only providing around 10% of total U.S. electricity generation. In 2021, wind power received estimated subsidies of $6.9 billion, while solar received $5.7 billion in subsidies. This highlights the much higher per-unit subsidy that wind and solar receive compared to other energy sources like natural gas and coal.
Proponents argue these subsidies are necessary for the continued growth of renewable energy. However, critics claim the subsidies distort energy markets and favor wind/solar over other options. Overall, it is clear that both wind and solar have been heavily subsidized by the federal government in recent years.
Sources:
https://int.nyt.com/data/documenttools/america-s-power-doc-1/6879834f06f3b364/full.pdf
Recent Cost Trends
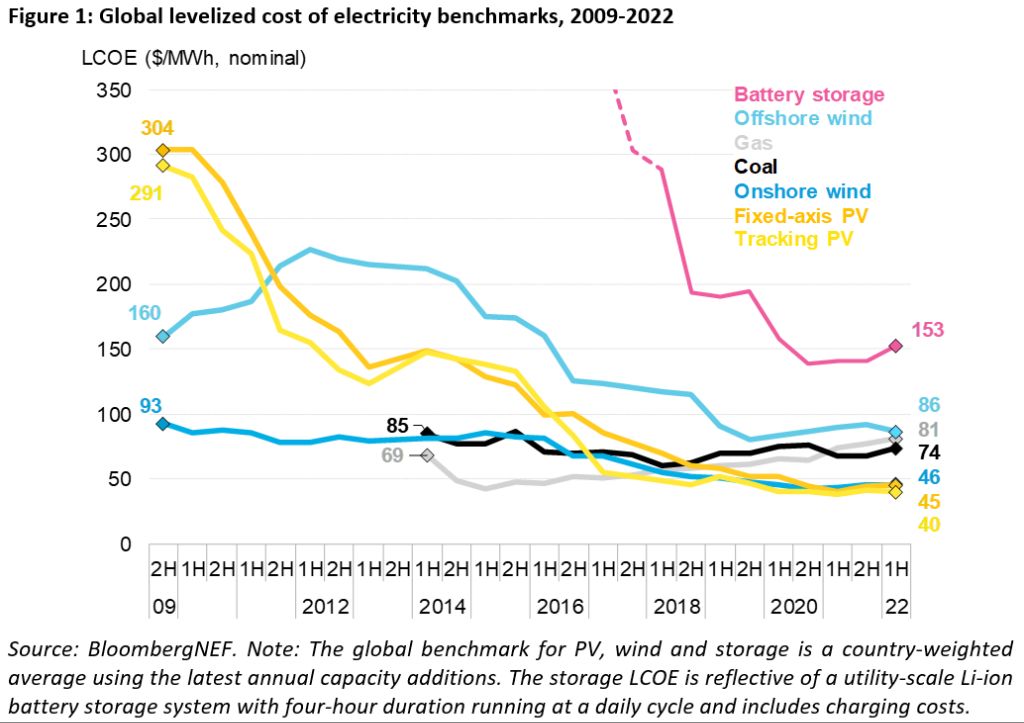
According to data from the International Renewable Energy Agency (IRENA), the global weighted average levelized cost of electricity (LCOE) for newly commissioned utility-scale onshore wind projects fell by 5% between 2021 and 2022, from $0.035/kWh to $0.033/kWh (https://www.irena.org/Publications/2023/Aug/Renewable-Power-Generation-Costs-in-2022). However, analysis from PV Magazine shows that in early 2023, average utility-scale solar LCOE increased for the first time this year, rising from $24/MWh to $96/MWh. Onshore wind LCOE also increased from $24/MWh to $75/MWh (https://www.pv-magazine.com/2023/04/14/average-solar-lcoe-increases-for-first-time-this-year/).
According to the International Energy Agency (IEA), supply chain pressures from COVID-19 and Russia’s invasion of Ukraine have disrupted cost reductions for solar and wind. As a result, global average LCOEs for onshore wind and solar PV are expected to remain 10-15% above 2020 levels in 2024 (https://www.iea.org/reports/renewable-energy-market-update-june-2023/will-solar-pv-and-wind-costs-finally-begin-to-fall-again-in-2023-and-2024).
Conclusion
When examining the costs of wind and solar power, both options have advantages and disadvantages. Upfront costs tend to be lower for wind, while ongoing maintenance is cheaper for solar. However, capacity factors and land usage favor wind power. Location also plays a major role, with solar performing better in sunnier areas and wind better in windier regions. Recent trends show solar panel prices dropping rapidly, but wind turbines have also gotten much cheaper.
Overall, there is no definitive answer to whether wind or solar is universally cheaper. The costs depend heavily on the specific circumstances, especially location. However, both technologies have clear economic viability and environmental benefits. Wind and solar prices are projected to continue falling, making renewable energy increasingly cost-competitive with fossil fuels.
In most cases, utilizing both wind and solar together provides greater reliability and economies of scale. Rather than choosing one single solution, integrating diverse renewable sources offers the most promising path to affordable, sustainable electricity generation.