How Much Solar Energy Is Currently In Use?
Introduction
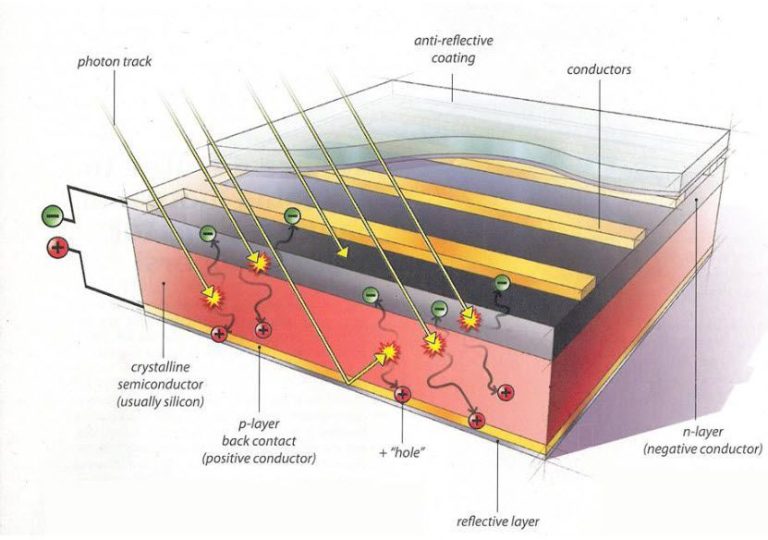
Solar energy has emerged as an important renewable energy source that harnesses the sun’s rays to generate electricity and heat. The amount of solar energy that reaches the Earth’s surface in one hour is enough to meet the world’s energy demands for an entire year (https://citeseerx.ist.psu.edu/document?repid=rep1&type=pdf&doi=933b3fdc8a661d0ae5f2b2fc311f954557b127e8). Solar power systems generate clean, emissions-free energy without any fuel costs or pollutants. As solar panel costs have declined dramatically and markets have expanded, solar energy usage has grown at unprecedented rates over the last decade. With concerns about climate change and energy security, solar power offers an abundant, sustainable energy solution.
Global Solar Energy Usage
According to the International Renewable Energy Agency (IRENA), global solar power capacity reached 987 gigawatts (GW) by the end of 2022. This represents a 24% increase from global solar capacity of 796 GW in 2021. In other words, nearly 200 GW of new solar power capacity was added worldwide last year.
Solar power capacity has grown exponentially over the past decade, from just 40 GW in 2010. The growth has been driven by falling costs and supportive policies. According to IRENA, the levelized cost of electricity from utility-scale solar photovoltaics declined by 85% between 2010 and 2019. This made solar power cost-competitive with fossil fuels in many parts of the world.
The International Energy Agency (IEA) predicts global solar capacity will reach over 1,500 GW by 2024. Key growth markets are expected to be China, India, the United States and Europe.
Solar Energy Usage by Country
China leads the world in total installed solar capacity, with around 430 GW as of 2023 according to The Top 5 Solar Countries in the World. This represents nearly a third of the global solar capacity. The rapid growth of solar in China has been driven by favorable policies and falling PV prices. In 2021, China added about 55 GW of new solar capacity, more than any other country.
The United States ranks second in the world with over 122 GW of installed solar capacity as of 2022, according to Wikipedia. Solar energy has been expanding rapidly in recent years, accounting for nearly 4% of total U.S. electricity generation. California leads the nation in installed capacity, followed by Texas, Florida, and North Carolina.
Japan comes third with around 71 GW of solar capacity. Germany and India round out the top five countries, with 59 GW and 55 GW respectively. Other leading countries for solar include Australia, Spain, Italy, South Korea, France and Brazil. The growth of solar globally has been driven by improved technology, falling prices, and favorable policies.
Solar Energy Usage in the US
The US has rapidly increased its solar energy capacity in recent years. In 2010, the country had just over 2 gigawatts (GW) of total installed solar capacity. By 2020, total US solar capacity had grown over 100 times to 250 GW. This made the US the world leader in total installed solar capacity, ahead of China.
Several factors drove the tremendous growth in US solar capacity over the past decade. Declining solar panel prices made solar power cost competitive with fossil fuels in many parts of the country. Federal and state policies like the solar Investment Tax Credit (ITC) and net metering made rooftop solar financially viable for homeowners and businesses. Major solar energy companies expanded domestic operations to meet rising demand.
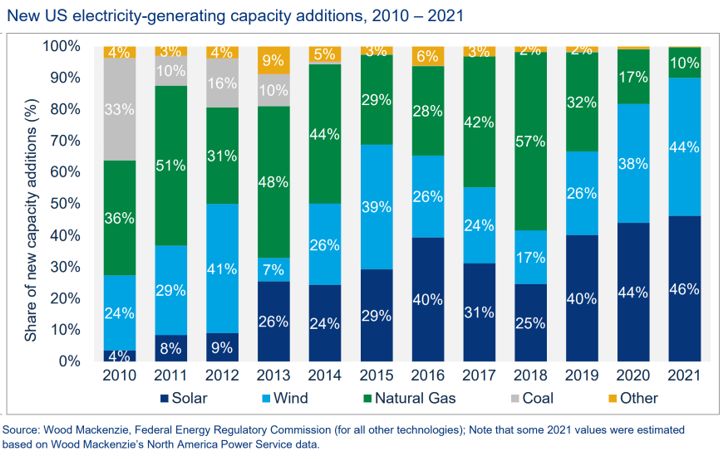
Looking at US solar growth on an annual basis shows how quickly capacity expanded year-over-year. In 2011, the country added just 1.9 GW of new solar capacity. But by 2016, over 14 GW of solar was installed, a nearly 8x increase in five years. This rapid growth rate has continued, with 2020 setting a new record of 19 GW of new solar capacity added.
Leading US States in Solar
When it comes to states with the most solar installations in the US, California and Arizona lead the way by a significant margin. According to a 2022 report by Statista, California has over 32,000 MW of installed solar PV capacity, while Arizona has around 8,000 MW. Other top states for solar include Texas, Florida, New Jersey, North Carolina, Nevada, New York, Massachusetts, and Utah.
California’s massive lead is due to its large population, abundant sunshine, and strong policy support for solar adoption. The state has nearly 40 million residents and widespread solar incentives and mandates that have made rooftop solar extremely popular. Arizona ranks second due to its very sunny climate and fast-growing population in cities like Phoenix. Solar power now provides about 12% of Arizona’s electricity.
While sunny states unsurprisingly tend to rank the highest for total solar installations, some states with less ideal solar resources like New Jersey and Massachusetts also make the top 10 list due to generous state-level incentives. However, when measuring solar adoption per capita, states like Hawaii, Nevada, Arizona, New Mexico, and Vermont rise to the top of the list.
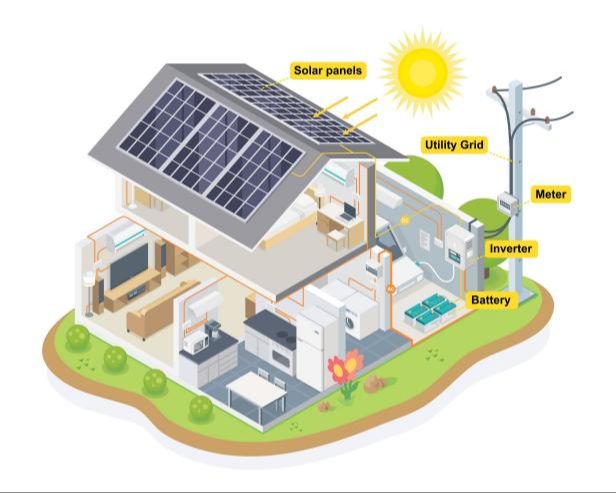
Residential Solar Usage
Rooftop solar panels on homes have become increasingly popular in recent years as the costs of solar technology have declined. According to the Energy Abstracts for Policy Analysis, over 1.5 million homes in the US had rooftop solar panels as of 2018. This number is projected to grow significantly in the coming years as solar costs continue to fall and homeowners seek to reduce electricity bills and their carbon footprint.
Commercial Solar Usage
A growing number of major companies are utilizing solar energy to power their operations. According to Forbes, companies like Amazon, Apple, Walmart, and Microsoft have tapped into solar energy https://www.forbes.com/home-improvement/solar/solar-energy-facts/. Target has installed solar panels capable of capturing 500 megawatts of solar energy across 500 stores, while Walmart has installed panels capable of 340 megawatts across 240 stores https://www.cnet.com/tech/mobile/target-walmart-solar-panels-stores/. The top 25 corporate users of solar energy have installed over 1 gigawatt of solar capacity according to an SEIA report https://www.greenconvergence.com/documents/Solar-Means-Business.pdf. Major companies are increasingly investing in solar to save on energy costs, power their operations sustainably, and meet renewable energy commitments.
Solar Energy Costs
The costs of solar energy have declined significantly over the past decade. This is mainly driven by advancements in solar panel technology that have increased efficiency while lowering manufacturing costs. In addition, market forces like increased demand and economies of scale have also contributed to bringing down the price of solar.
According to industry estimates, the average cost of solar panel installation for residences has dropped by more than 60% over the past 10 years. In 2010, the average price per watt for residential systems was around $7. Today it stands at about $2.7 per watt.
For utility-scale solar farms, the decline has been even more dramatic. In 2010, prices were around $4 per watt. But as of 2019, costs have fallen to around $1 per watt. This 85% cost reduction has made large-scale solar projects much more financially viable.
Further innovations in solar technology like improved energy storage and solar materials could drive costs even lower in the future. If current cost reduction trends continue, solar power is on track to become one of the cheapest sources of electricity generation within the next few years.
Solar Energy Projections
Solar energy usage has been growing rapidly in recent years and is expected to continue expanding in the coming decades. According to The Energy Grid, the solar industry is projected to continue its growth trajectory with solar becoming increasingly cost competitive. They cite that the amount of solar installed globally grew 929% from 2010 to 2021. Further research from Cladco finds that global solar capacity reached 942 GW in 2021, up from just 40 GW in 2010. Based on solar energy growth projections, annual installations of solar panels are expected to continue increasing in the future. SafeAtLast.co reports that by 2030, total global solar capacity could reach over 4,000 GW, a more than 4x increase from today.
Challenges and Opportunities
While solar power usage has grown significantly in recent years, there are still challenges to wider adoption. Some key obstacles include the high upfront costs of solar panel installation for homes and businesses, the need for advances in energy storage technology, and the intermittent nature of solar power that requires supplemental sources when the sun isn’t shining (UHasselt).
However, new technologies and declining costs are creating opportunities to expand solar usage. Some promising developments include more efficient solar cell designs, floating solar panels that can be deployed on bodies of water, and improved battery storage capabilities to enable around-the-clock solar power (Typeset). With continued innovation and policy support, solar is poised to play a major role in the global transition to renewable energy.