How Much Solar Energy Is Being Produced In The Us?
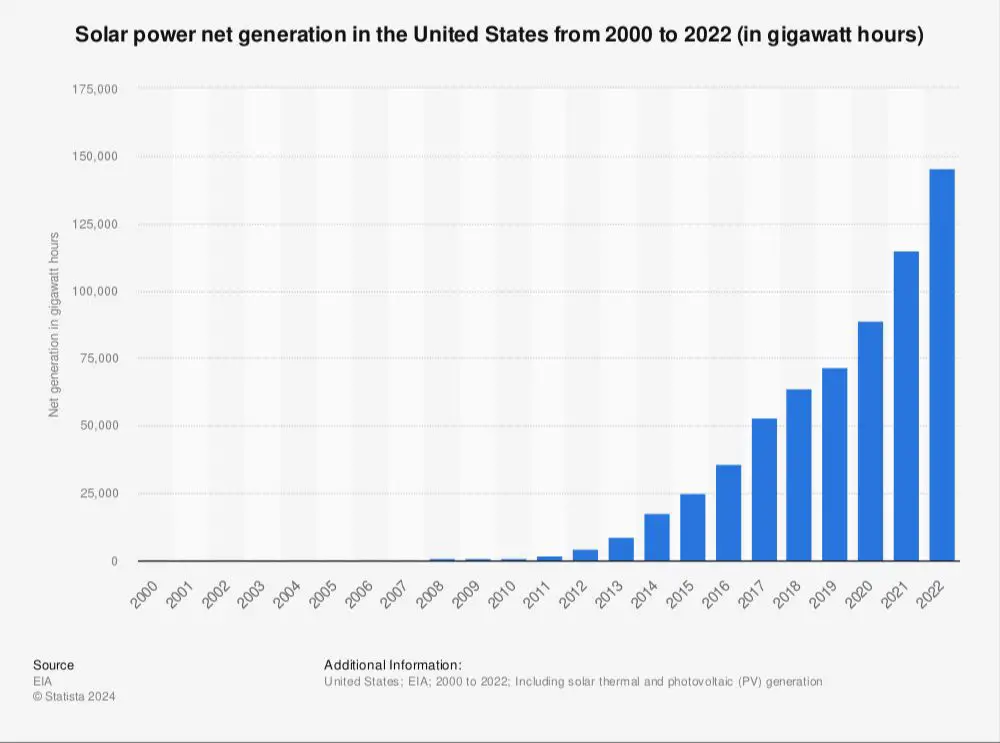
The growth of solar energy in the US over the past decade has been dramatic. According to CleanTechnica, solar energy capacity in 2021 was over 5 times what it was in 2011. This exponential growth has been fueled by declining costs as well as supportive policies and incentives. The Inflation Reduction Act, passed in 2022, is expected to further accelerate solar deployment in the coming years. Despite some recent headwinds, the solar industry has established itself as a major player in the US energy mix and has significant room left to run.
Current Solar Energy Capacity
As of January 2023, the total solar power capacity in the United States was 73.5 gigawatts (GW), according to the U.S. Energy Information Administration (U.S. EIA). This accounts for approximately 6% of the total U.S. electricity generation capacity. In 2021, total U.S. solar capacity was 51 GW, so capacity grew by 44% from 2021 to 2023.
The growth in solar capacity has accelerated in recent years due to declining costs and supportive policies. In 2016, total U.S. solar capacity was only around 40 GW, so solar capacity has nearly doubled over the last 7 years (Wikipedia). The Solar Energy Industries Association projects U.S. solar capacity to reach 178 GW by the end of 2023, reflecting robust growth (Reuters).
Solar Energy by State
California and Texas are the leading states for total installed solar electricity capacity according to the Solar Energy Industries Association (SEIA). As of Q4 2022, California had 38,240 MW of total installed solar electric capacity, accounting for 31% of the U.S. total. Texas came in second with 15,047 MW of capacity and 12% of the national total. Other top states include North Carolina, Florida, Arizona, New Jersey, Nevada, Massachusetts, New York, and Georgia. These top 10 states make up 82% of the total solar electric capacity in the U.S.
When looking at capacity installed per capita, smaller states rise to the top of the list. New Jersey has the most watts of solar installed per person with 903 watts, followed by Hawaii (876 watts), California (751 watts), Arizona (611 watts), and Nevada (601 watts) according to 2021 data from Solar SME. This demonstrates that solar energy adoption is gaining traction across states of all sizes.
The solar energy potential across states varies widely based on latitude and average sunlight hours. States like California, Texas, and Florida have abundant solar resources to leverage. Meanwhile, northeastern states face greater challenges for solar adoption due to fewer peak sunlight hours. However, improving solar panel technology and energy storage solutions are making solar power more viable across an increasing portion of the country.
Residential Solar
As of 2022, approximately 2.7% of homes in the US have solar panel installations according to usafacts.org. This equates to around 3.2 million homes with rooftop solar panels across the country based on data from Consumer Affairs [1]. The percentage of homes with solar has been increasing steadily each year. In 2020, 3.7% of single family homes had solar panels installed, up from 2.8% in 2019 according to the US Energy Information Administration [2]. California leads the nation with over 1 million homes powered by solar energy. Other states with high adoption of residential solar include Arizona, New Jersey and New York.
Utility-Scale Solar
Utility-scale solar refers to large solar power plants that generate electricity to be sold to utilities or large commercial customers. As of January 2023, there was 73.5 gigawatts (GW) of utility-scale solar capacity operating in the United States, accounting for over 40% of the country’s total solar capacity according to the U.S. Energy Information Administration (https://www.eia.gov/todayinenergy/detail.php?id=55719).
Most utility-scale solar farms consist of ground-mounted photovoltaic (PV) solar panels arranged in rows over a large area. The average size of a new utility-scale solar project completed in 2021 was 105 megawatts according to SEIA and Wood Mackenzie (https://www.seia.org/us-solar-market-insight). These large-scale solar farms are usually developed and owned by energy companies, and the electricity generated is fed into the transmission grid. Many have power purchase agreements with utilities to sell the electricity under long-term contracts.
The top states for installed utility-scale solar capacity as of Q3 2022 were California, Texas, Florida, Arizona, and North Carolina according to SEIA data (https://www.seia.org/us-solar-market-insight). Utility-scale solar is expected to continue expanding rapidly, with over 32 GW of new capacity forecast to be installed in 2023 according to Wood Mackenzie (https://www.reuters.com/business/energy/us-solar-power-capacity-expand-by-record-32-gigawatts-2023-report-2023-09-07/).
Solar Energy Costs
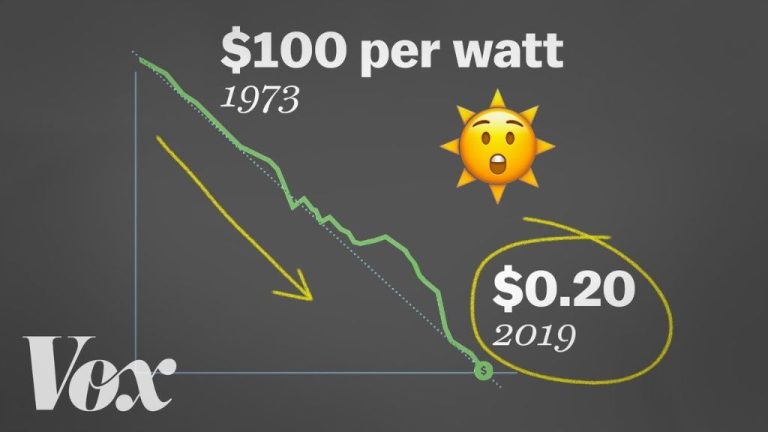
The cost of solar energy has seen significant declines in the past decade, according to a 2021 report from the National Renewable Energy Laboratory (NREL). The report found that the cost of residential, commercial, and utility-scale solar photovoltaic (PV) systems dropped by more than 65% between 2010 and 2020.
For example, the median installed price of residential solar PV systems fell from about $7.70 per watt in 2010 to $2.60 per watt in 2020. This represents an average annual decline of 13% per year. Similarly, utility-scale PV system costs fell from around $3.80 per watt in 2010 to $0.80 per watt in 2020.
There are a few key factors driving these cost declines according to experts. First, improvements in solar panel technology and manufacturing processes have steadily driven down the cost of solar modules. Second, economies of scale resulting from massive global growth in solar installations have led to lower balance of system costs.
In addition, advancements in areas like racking, wiring, and power electronics have also helped reduce non-module costs. Going forward, most analysts predict solar costs will continue to fall, though likely at a slower pace than the rapid declines seen over the past 10 years.
Solar Energy Jobs
The solar industry has experienced rapid job growth in recent years. According to the 2022 National Solar Jobs Census report by the Solar Energy Industries Association, there were 263,882 solar jobs in the United States as of 2022, representing an increase of 9.7% from 2020 (Solar Jobs Census, IREC). This includes jobs across the solar supply chain from manufacturing to project development and installation.
The growth in solar jobs can be attributed to the declining costs of solar panels leading to greater deployment, as well as supportive policies like renewable portfolio standards, tax credits, and net metering. Most solar jobs are in the installation sector with 149,378 jobs, followed by manufacturing, project development, sales & distribution, and operations & maintenance. The state with the most solar jobs is California with 75,045 jobs.
Solar Energy Projections
The solar energy industry is projected to see significant growth in the coming years. According to the Solar Energy Industries Association (SEIA), the United States is expected to add over 60 gigawatts (GW) of solar capacity annually through 2025. In 2023 alone, the U.S. is forecast to install 33 GW of new solar capacity, representing a new record high.
Longer-term projections also point to exponential growth for solar power. Solar currently accounts for just over 4% of U.S. electricity generation. However, according to Deloitte analysis, solar penetration is estimated to reach 20% by 2040 under a base scenario, and could reach as high as 38% under an advanced technology scenario.
The main drivers for increased solar adoption include declining costs, supportive policies, corporates sustainability commitments, and improved energy storage technology. While the growth rate may fluctuate year-to-year, most experts agree that the overall solar trajectory will continue rising over the next two decades.
Environmental Impact
Solar energy has an overwhelmingly positive impact on the environment. According to the U.S. Department of Energy, solar power does not produce any air pollution or greenhouse gases when generating electricity (1). This makes it a clean, renewable source of energy that can help combat climate change. The Energy Information Administration notes that switching from fossil fuels to solar energy for electricity generation can dramatically reduce greenhouse gas emissions (2).
In particular, solar photovoltaic panels and concentrated solar thermal plants do not release any toxic materials or greenhouse gases. Solar hot water systems also avoid greenhouse gas emissions compared to conventional water heating methods. Overall, organizations like EnergySage highlight that increased adoption of solar can significantly decrease America’s carbon footprint and help protect the planet (3).
Sources:
(1) https://www.energy.gov/eere/solar/solar-energy-wildlife-and-environment
(2) https://www.eia.gov/energyexplained/solar/solar-energy-and-the-environment.php
(3) https://www.energysage.com/solar/health-environmental-benefits-of-solar-energy/
Challenges & Opportunities
The future growth of solar energy in the United States will depend on several key factors. According to research from the MIT Energy Initiative, the biggest challenges are reducing costs and improving efficiency of solar technologies. The variability and intermittency of solar power also presents grid integration challenges as solar penetration increases. However, there are opportunities to overcome these challenges through continued research, development of energy storage solutions, regulatory and market reforms, and innovative business models that broaden solar energy access.
The U.S. Department of Energy projects that with supportive public policies, improvements in solar technologies, and falling prices, the solar industry could employ up to 1.6 million people by 2050. Realizing this future will require policies that facilitate rapid solar deployment, access to financing, and fair compensation for solar’s grid benefits. The solar industry will also need to continue driving down costs and improving performance to compete with other energy sources. If these opportunities are seized, solar power has the potential to become a major pillar of a clean, renewable U.S. energy system.