Which State Now Generates More Than 5% Of Electricity From Utility-Scale Solar?
The use of solar power has grown exponentially in recent years. According to Solar Power Growth #1 in 2016, the amount of solar photovoltaic (PV) capacity installed worldwide increased by 50% in 2016 alone. This massive growth is thanks to falling costs and supportive government policies aimed at expanding renewable energy. As solar power continues its rapid rise, some states are emerging as leaders in harnessing the sun’s energy.
Solar Power Growth
Solar power generation has seen rapid growth in recent years. According to the Solar Energy Industries Association (SEIA), solar power accounted for 3% of total U.S. electricity generation in 2020, up from just 0.1% in 2010. In 2021, solar accounted for over 4% of utility-scale electricity generation.
The SEIA reports that solar power generation has increased by over 50 times from 2008 to 2021. In 2021 alone, solar generation increased 23% from the previous year. The U.S. Energy Information Administration (EIA) projects that utility-scale solar generation will continue growing significantly, increasing by 11% from 2023 to 2025.
Several factors are driving solar energy growth, including falling costs and supportive government policies. The SEIA reports that the cost to install solar has dropped by more than 70% over the last decade, making it increasingly competitive with conventional energy sources. State renewable portfolio standards, federal tax credits, and other policies have also encouraged solar adoption. With costs expected to continue falling, analysts project strong continued growth for solar power generation in the coming years.
Sources:
https://www.seia.org/solar-industry-research-data
https://www.eia.gov/todayinenergy/detail.php?id=61242
States Leading in Solar
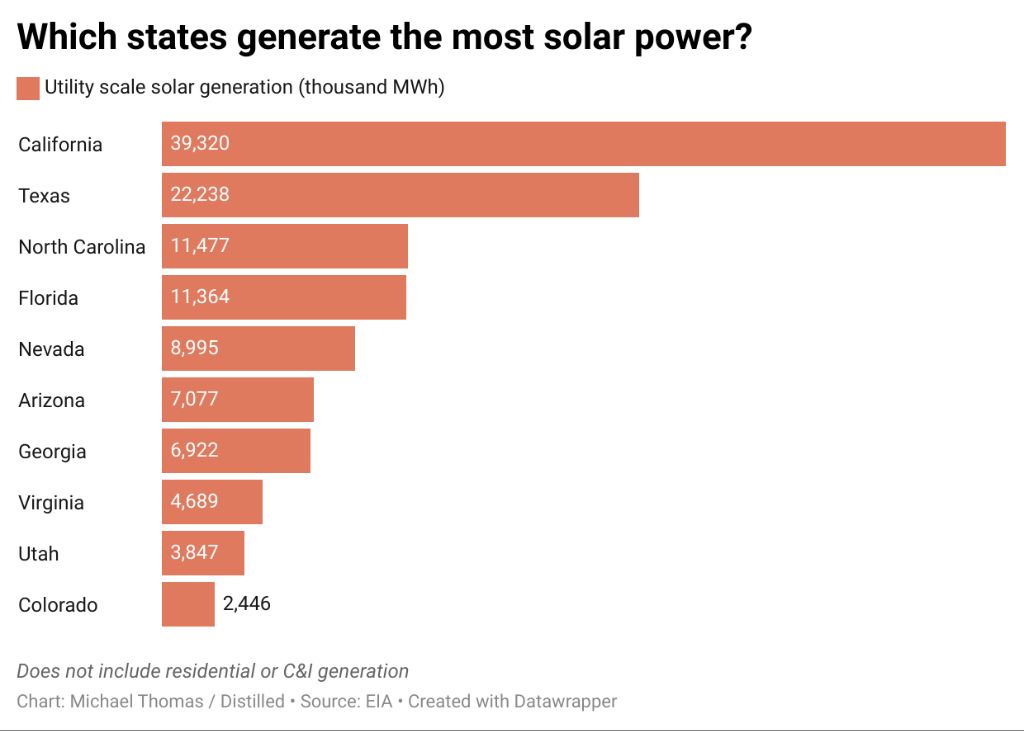
Many U.S. states have embraced solar power and invested heavily in expanding solar generation capacity. According to the Solar Energy Industries Association (SEIA), the top states in terms of installed solar PV capacity as of Q3 2022 are:
1. California – 44,626 MW 1
2. Texas – 17,352 MW 1
3. Florida – 6,045 MW 1
4. Arizona – 4,775 MW 1
5. North Carolina – 4,673 MW 1
California leads by a wide margin, with over 44,000 MW of solar PV capacity installed as of Q3 2022. This is more than double the capacity of the next highest state, Texas. Other top solar states include Florida, Arizona, North Carolina, New Jersey, Nevada, New York, Massachusetts, and Georgia.
Percentage from Solar
When examining solar power generation by state in terms of percentage of total state electricity production from solar, California leads with 16,262 megawatts generated from solar, which is 27.8% of their total electricity production according to the Solar Energy Industries Association’s State-By-State Map. Other top states by percentage of electricity generated from solar include Nevada at 23.9%, Massachusetts at 21.9%, Hawaii at 18.1%, and Arizona at 13.9%.
Solar power represents a significant and growing percentage of total electricity generation in leading solar states. According to Choose Energy, California generates over 27% of its electricity from utility-scale solar power. The next highest states are Nevada at nearly 24%, followed by Massachusetts and Hawaii both over 18%. Solar Power Generation by State – Choose Energy.
While California generates the highest total megawatts from solar, on a percentage basis, solar accounts for a larger share of Nevada’s and Massachusetts’ total electricity generation. Solar power’s growth demonstrates its increasing importance as an energy source across the country.
The 5% State
California has emerged as the state generating over 5% of its electricity from utility-scale solar power. According to recent statistics, California now obtains more than 5.5% of its total electricity generation from large-scale solar plants. This is a significant milestone, as California becomes the first state in the U.S. to cross the 5% solar threshold for utility-scale generation.
With abundant sunshine and open spaces, California has pursued an aggressive strategy to adopt renewable energy. The state has incentivized solar power adoption through tax credits, rebates and net metering policies. Major solar projects have been constructed across the state’s deserts and farmlands.
According to the U.S. Energy Information Administration (EIA), California generated over 30 million megawatt-hours of utility-scale solar power in 2019. With total generation of around 550 million MWh, this equates to over 5.5% from utility-scale solar. EIA data shows California solar generation continuing to grow, on track to make up an even greater portion of the state’s electricity mix in coming years.
Passing the 5% solar milestone demonstrates California’s leadership in renewable energy. As the world’s fifth largest economy, California paving the way for solar can drive broader national and global adoption of this emissions-free energy source.
Utility-Scale Solar
Utility-scale solar refers to large solar photovoltaic (PV) installations that generate electricity to feed into the electric grid rather than supplying a home, business, or microgrid. According to the Clean Coalition, utility-scale solar systems have a capacity of 1 megawatt (MW) or greater and are primarily ground-mounted systems. The Solar Energy Industries Association more specifically defines utility-scale as systems with a capacity of 5 MW or greater.
These large-scale solar facilities feed electricity directly into transmission lines and the electric grid. They help utilities meet electricity demand efficiently and offset more carbon-intensive forms of generation. Utility-scale solar provides economies of scale that can lower costs compared to smaller distributed solar.
Solar Potential
California has by far the greatest installed capacity of solar photovoltaic (PV) power of any U.S. state, with over 30 gigawatts (GW) as of 2022 according to Statista. The state benefits from plentiful sunshine and large areas of open land conducive to utility-scale solar farms. According to a comparison by the Nebraska Energy Office, California ranks number one among U.S. states for solar energy potential based on its high sun index. The abundant solar resources available across the southern and central regions of the state make California uniquely suited for solar power generation.
Government Policies
State government policies have played a major role in enabling the growth of utility-scale solar energy. According to Solar Incentives by State in 2024 (https://www.solar.com/learn/solar-rebates-by-state/), some states offer property tax exemptions, sales tax exemptions, solar renewable energy credits (SRECs), and rebate programs to incentivize solar adoption. For example, North Carolina offers a property tax exemption on the added value solar brings to a home, reducing costs for system owners (https://www.bankrate.com/homeownership/solar/tax-incentives-by-state/). Many states also allow net metering, which lets solar system owners sell excess energy back to the grid. The federal government provides investment tax credits, allowing taxpayers to deduct 26% of installation costs from federal taxes in 2024 (https://www.forbes.com/home-improvement/solar/solar-tax-credit-by-state/). State and federal incentives lower the cost of solar, encouraging utility-scale solar growth.
Future Outlook
Solar power generation is projected to continue growing rapidly in the coming years. According to the Solar Energy Industries Association (SEIA), solar generation is expected to triple in the next 5 years across the country (State-By-State Map | SEIA). The leading solar states are forecasted to install the most new solar capacity over the next several years.
For example, Texas is projected to add over 4 GW of new solar capacity in the next 5 years, the most of any state according to SEIA projections (State-By-State Map | SEIA). Florida and California also lead the country in projected new solar additions over the next 5 years at nearly 4 GW and 3.4 GW respectively (State-By-State Map | SEIA). The sunny climate and supportive policies in leading solar states will enable substantial growth in solar power generation in the coming years.
Conclusion
In conclusion, California reaching over 5% of its electricity generation from utility-scale solar power is a major renewable energy milestone. As the most populous U.S. state, California’s achievement demonstrates solar’s increasing viability and potential to meaningfully contribute to America’s energy mix. With abundant sunshine, supportive policies, and innovation in solar technology, California is leading the way and providing a model for solar expansion that other states can follow. Reaching 5% solar electricity is an encouraging step toward a clean energy future that all states can strive for.