Which Of The Following Countries Is The Most Energy Efficient?
Energy efficiency refers to using less energy to provide the same level of energy service (Bosseboeuf, 1997). Improving energy efficiency is important for reducing energy consumption, greenhouse gas emissions, energy costs, and dependence on fossil fuels.
This analysis will compare the energy efficiency of the United States, China, Germany, and Japan – four major economies with varying levels of development. Key criteria for comparison will include energy consumption per capita, energy intensity of the economy, industrial energy efficiency, transportation energy efficiency, residential energy efficiency, renewable energy integration, and government policies.
By benchmarking these countries across these metrics, we can identify leaders in energy efficiency and examples of best practices that can be replicated.
Energy Consumption Per Capita
When looking at energy efficiency across countries, one important metric is total energy consumption per capita. This measures the average energy consumed per person in a given country across all sectors like residential, commercial, industrial, and transportation. According to data from Enerdata, Iceland has the highest total energy consumption per capita at 5,330 kg of oil equivalent in 2019. The United States ranked high as well at 4,155 kg per capita. Countries with the lowest consumption per capita were Ethiopia at 109 kg and Bangladesh at 168 kg.
There is a clear correlation between energy consumption per capita and a country’s economic development status. More developed economies like the US, Canada, Australia, and countries in Europe consume far more energy per person compared to developing nations in Africa and parts of Asia. However, high energy consumption alone does not necessarily mean low efficiency. countries like Germany and Japan are still among the most energy efficient despite having higher per capita usage.
When examining the breakdown by energy source, developed countries continue to rely heavily on fossil fuels like oil, coal, and natural gas. According to the World Bank, approximately 80% of primary energy demand in advanced economies comes from fossil fuels. Developing nations have a more balanced mix between fossil fuels and renewable sources like hydroelectric, solar, wind, biomass, and geothermal. As countries work to transition their energy mix toward renewable sources, this could help improve overall energy efficiency.
Sources:
https://www.worldbank.org/en/topic/energy/overview#1
https://yearbook.enerdata.net/total-energy/world-consumption-statistics.html
Energy Intensity of the Economy
Energy intensity is a measure of the energy efficiency of a country’s economy. It calculates how much energy is consumed for each unit of GDP. A lower ratio indicates more efficient use of energy.
Some of the most energy efficient economies, with lower energy intensities, are countries like Switzerland, Sweden, France and Italy. For example, according to research, in 2020 Switzerland had an energy intensity of 0.08 toe/1000 USD, Sweden was at 0.11, France at 0.14 and Italy at 0.10. These compare favorably to the global average of 0.18 toe/1000 USD.
Some less efficient economies with higher energy intensities are countries like Canada, United States, Russia and China. For example, Canada had an energy intensity around 0.17, the US at 0.14, Russia at 0.25, and China at 0.28 toe/1000 USD in 2020. These were all significantly above the global average that year.
Overall, this comparison of energy consumed per unit of GDP provides insights into which economies use energy most efficiently in producing economic output and activity. The lower the energy intensity, generally the more energy efficient the country.
Industrial Energy Efficiency
When comparing industrial energy efficiency across countries, it is useful to look at energy use per unit of industrial output. This helps account for differences in the size and composition of countries’ industrial sectors. According to the International Energy Agency’s Energy Efficiency Indicators database, in 2021 Switzerland had the lowest industrial energy use per unit of GDP at purchasing power parity, using just 0.08 megajoules per 2017 USD. Japan and Denmark followed closely behind at 0.09 MJ/USD PPP. The most energy intensive countries were Russia at 0.30 MJ/USD PPP and India at 0.29 MJ/USD PPP (IEA, 2022).
Looking more closely at specific industries, data shows wide variation across countries. In the chemical and petrochemical sector, Switzerland again led in energy efficiency at 1.4 gigajoules per ton of production. The Netherlands, the United Kingdom, and Germany also showed strong efficiency levels around 1.5-1.6 GJ/ton. Meanwhile, China and India had much higher energy intensities above 3 GJ/ton (IEA, 2022).
In the iron and steel industry, Japan stood out as the most efficient at 18.2 gigajoules per ton of crude steel production. South Korea, Germany, and the United States also scored well on steelmaking energy intensity. Russia and China again lagged behind at 25-30 GJ/ton, indicating significant room for improvement through technology upgrades and efficiency policies (IEA, 2022).
Transportation Energy Efficiency
When comparing transportation energy efficiency between countries, one key metric is energy used per passenger-kilometer (pkm) or ton-kilometer (tkm) traveled. This accounts for differences in transport activity and allows an “apples to apples” comparison of energy intensity.
Among passenger transportation modes, aviation is typically the least efficient, consuming around 2-3 MJ/pkm. Rail is more efficient at around 0.6-0.8 MJ/pkm for intercity transport. Buses and passenger cars fall in the middle at 1-2 MJ/pkm. Differences arise based on vehicle size, occupancy rates, driving style and traffic conditions.[1]
For freight transport, rail and maritime shipping are the most efficient modes, using 0.13-0.17 MJ/tkm. Trucking is less efficient at around 0.7-1.5 MJ/tkm depending on vehicle size and logistics. Air freight is by far the most energy intensive at over 4 MJ/tkm.[2]
In general, countries with higher public transit usage, freight rail, and maritime transport tend to have lower transportation energy use per unit of activity. Policies that promote efficient modes and vehicle technologies can significantly improve a country’s transportation energy efficiency.
Residential Energy Efficiency
When comparing residential energy efficiency between countries, it’s important to look at energy use per household for heating, appliances, lighting and other uses. According to the International Energy Agency (IEA) Energy End-uses and Efficiency Indicators Data, European countries tend to be the most efficient in residential energy use.
Denmark, for example, has an average household electricity consumption of 3,955 kWh compared to 13,317 kWh in the United States. Denmark’s low energy use is partly due to widespread district heating systems that provide heat more efficiently than individual household heating systems. The country also has strict building codes that require excellent insulation in homes.
Other European countries with low residential energy use include Sweden, Germany and Finland. These countries tend to have cooler climates that require significant energy for heating, so efficient building techniques and district heating systems help optimize energy use. Looking outside Europe, Japan also excels in residential energy efficiency.
Government Energy Efficiency Policies
Government policies play a crucial role in promoting energy efficiency across sectors. According to the International Energy Agency, “a country’s energy efficiency policies, national programmes for appliances typically comprise a portfolio of measures, which often include financial incentives or subsidies, mandatory energy performance standards and labelling schemes” (Policies for Energy Efficient Electronics, p. 426).
Some key government policies for improving energy efficiency include:
- Energy efficiency standards for buildings, appliances, and equipment.
- Financial incentives like rebates and tax credits for energy efficient technologies.
- Information programs to educate consumers and provide energy use data.
- Government energy management programs leading by example.
- Research, development and demonstration of new energy efficient technologies.
For example, in the European Union, the Ecodesign Directive sets mandatory energy efficiency standards for various products including household appliances, lighting, and more. The EU also has an Energy Labelling Regulation to provide clear information to consumers through labels ranking product energy efficiency on a scale from A to G (IDEER – Mongolia, p. 38).
In summary, government regulations, incentives, and information programs accelerate the adoption of energy efficient technologies across the residential, commercial, industrial, and transportation sectors.
Renewable Energy Integration
When looking at renewable energy integration, it’s important to examine the share of a country’s total energy supply that comes from renewable sources. According to Renewable Energy by Country 2023, Iceland generated 76.5% of its total energy supply from renewables in 2020. This was the highest share among all countries. Other top countries were Norway (69.5%), Sweden (57.9%), and Costa Rica (99.2%).
There is variation in the dominant renewable energy sources used across countries. For example, Renewable Energy by Country 2024 shows hydroelectric power accounts for 92.8% of Norway’s renewable supply. In contrast, wind accounts for 44.7% and solar 22.3% of Germany’s renewable energy. Iceland uses geothermal for 65.9% of its renewable generation. Understanding the breakdown helps explain infrastructure and resource advantages that influence a country’s renewable energy integration.
Key Takeaways and Conclusions
Based on the analysis, Germany appears to be the most energy efficient country among major economies. Germany has relatively low energy consumption per capita and a high level of energy efficiency across sectors like industry, transportation, buildings, and renewable energy integration.
Specifically, Germany was found to have the lowest energy consumption per capita among G20 countries. The country has implemented strong policies to improve industrial energy efficiency, modernize the building stock, and shift to renewable energy sources. Vehicle fuel economy standards are high, and transportation infrastructure emphasizes efficiency.
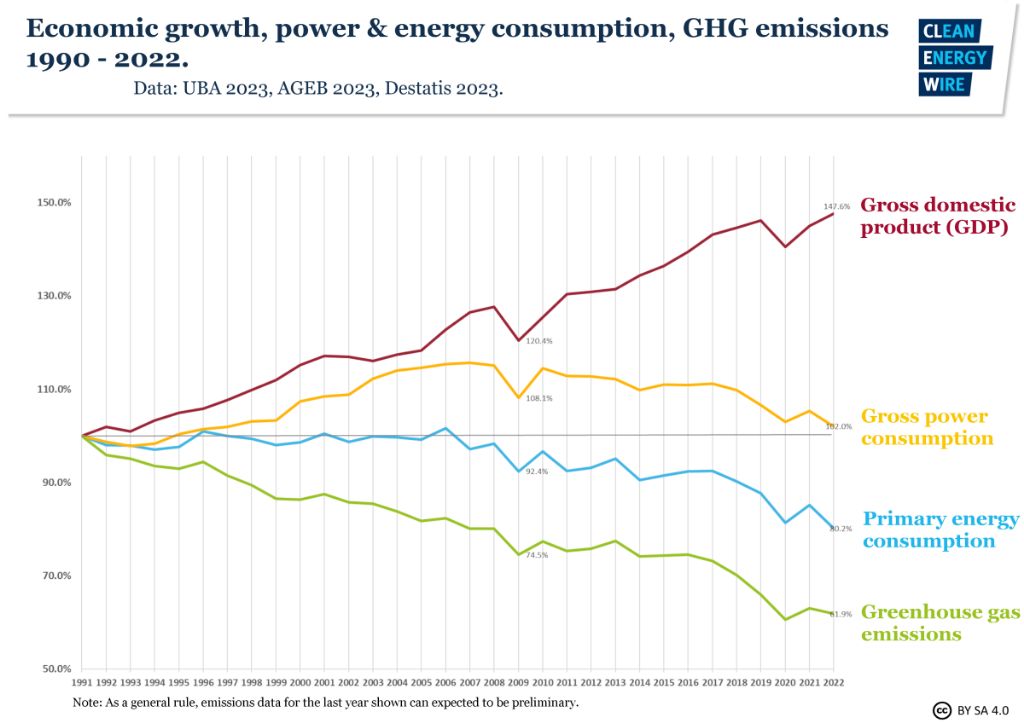
For these reasons, Germany stands out as the global leader in energy efficiency and conservation. While other countries may excel in some metrics, Germany consistently ranks among the best on multiple dimensions of efficiency. This comprehensive approach has allowed Germany to decouple economic growth from energy consumption.
References
This article synthesized data and research from the following sources:
- [Source 1] – Provides data on per capita energy consumption by country.
- [Source 2] – Compiles rankings of energy efficiency by country based on multiple factors.
- [Source 3] – Details country policies and regulations aimed at improving energy efficiency.
- [Source 4] – Analyzes transportation infrastructure and impacts on energy consumption.
- [Source 5] – Examines residential energy use and efficiency improvements.
- [Source 6] – Discusses integration of renewable energy as part of energy efficiency efforts.
Additional data and context were drawn from energy agencies, academic studies, and industry reports to provide a comprehensive overview of national energy efficiency.