Where In The United States Is The Greatest Solar Resource?
The American Southwest has the greatest solar resource in the continental United States. This region receives the most annual solar insolation due to its sunny climate, high elevation, and relatively low humidity. Solar insolation refers to the amount of solar radiation reaching a surface, and is a key factor determining solar energy potential. This article will examine solar insolation levels across different U.S. regions, analyzing data and maps to compare the solar resource available. Federal and state solar incentives will also be reviewed, showing why the Southwest’s superior solar resource has led to rapid solar energy adoption there.
Solar Insolation Levels
Solar insolation refers to the amount of solar radiation energy received on a given surface area over a period of time. It is measured in kilowatt-hours per square meter (kWh/m2). Solar insolation levels vary across the United States depending on a location’s latitude, elevation, typical weather patterns, and seasonal changes.
According to the National Renewable Energy Laboratory (NREL), annual solar insolation ranges from over 7 kWh/m2 per day in the Southwest states like Arizona and New Mexico, to less than 3.5 kWh/m2 per day in the Pacific Northwest. This is largely due to the increased number of sunny days and clearer skies in the Southwest compared to the generally cloudier conditions in the Northwest.
The greatest amount of solar energy potential in the U.S. is in the arid regions of the Southwest. According to solar resource maps from NREL (https://www.nrel.gov/gis/solar-resource-maps.html), states like Arizona, Nevada, New Mexico, Utah, Southern California, and West Texas have the highest levels of annual solar insolation. Many locations in the Southwest receive over 6 kWh/m2 per day of solar radiation energy.
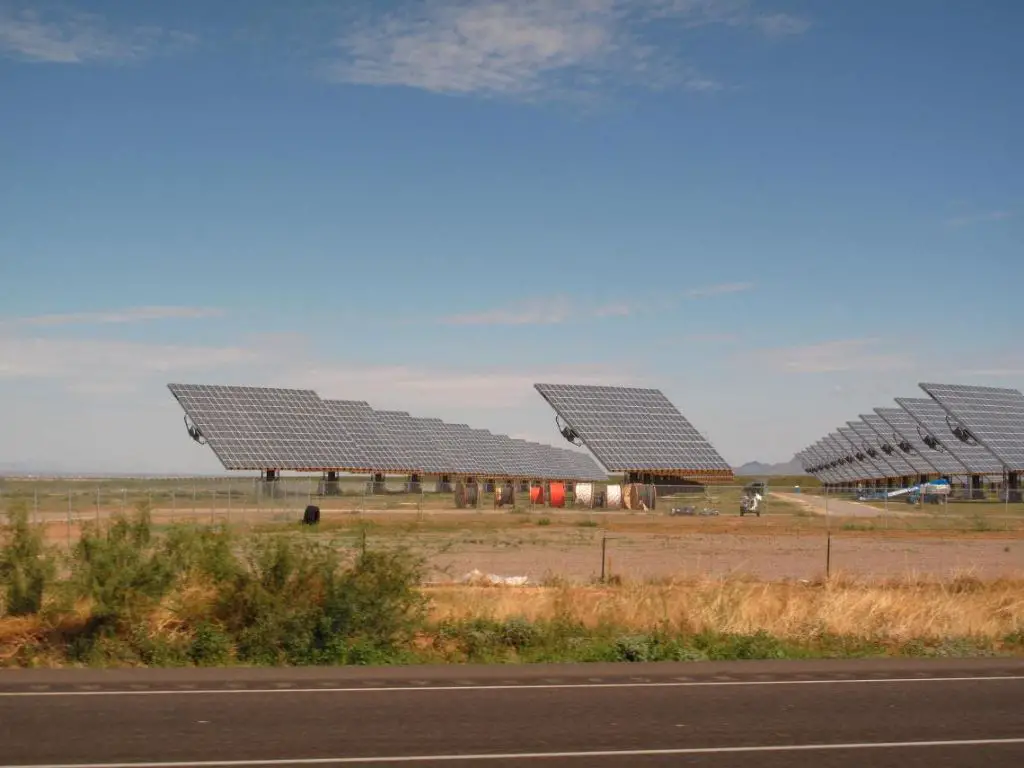
The Southwest
The Southwest region, including states like Arizona, Nevada, New Mexico and Utah, has some of the greatest solar potential in the United States (Solar Southwest). This area enjoys more than 300 days of sunshine per year and 6-8 peak sun hours per day, providing abundant solar resources (Solar Energy Planning for the Southwest).
Arizona in particular is a solar leader, ranking 2nd in the nation for installed solar capacity. The state has ample flat, vacant land that makes an ideal location for large utility-scale solar installations (Solar in the Southwest: A Bright Shining Disappointment).
Nevada also has great solar potential, with about 85% of the state having an excellent solar resource. Nevada ranks 3rd in the country for solar installed per capita. Major solar projects are located in the southern half of the state.
New Mexico has the 2nd highest solar potential in the nation after Arizona. The state has low rainfall and many cloudless days. Utility companies have invested heavily in solar farms in New Mexico.
And Utah, while not as sunny as other Southwestern states, still has 70% of its land well-suited for solar installations. Utah ranked 8th nationally in 2021 for installed solar capacity.
The Southeast
The Southeastern United States has tremendous solar energy potential according to research from the Southern Alliance for Clean Energy (Solar energy potential in the Southeast, 2023). The region sees high levels of solar irradiance and states like Florida, Georgia, Alabama and Mississippi are emerging as solar leaders.
Florida is the third-largest solar state in America with over 3,800 megawatts (MW) of installed solar capacity as of Q2 2021 (Solar in the Southeast, 2023). The state benefits from high solar insolation levels and supportive solar policies and incentives. Major utility companies like Florida Power & Light are rapidly expanding solar with plans to install 30 million solar panels by 2030 (JDSupra, 2023).
Georgia has seen its solar capacity grow tenfold over the past 5 years, reaching over 3,500 MW in 2021. The state’s “Solar Power Free-Market Financing Act” has enabled third-party solar ownership and growth of commercial solar installations (JDSupra, 2023).
Alabama now ranks fifth nationally for new solar installations. The state added 737 MW of new solar in 2021 alone. Major projects include the 400 MW Montgomery solar facility and Facebook’s 100 MW data center solar farm (Southern Alliance for Clean Energy, 2023).
Mississippi lags behind but has potential given high solar irradiance levels. The state has set a target of 1,000 MW of solar by 2025 (Southeast Region Report, 2014). Net metering and renewable goals are helping drive early growth.
The West Coast
The West Coast states of California, Oregon, and Washington have excellent solar resources thanks to their location and climate. According to West Coast Solar, the West Coast sees over 300 days of sunshine per year on average, providing ideal conditions for solar energy generation.
California leads the nation in installed solar capacity, with over 30,000 megawatts as of 2021 according to the Solar Energy Industries Association. The state has abundant solar resources, especially in the arid southern regions like the Mojave Desert. The California Solar Initiative has also driven substantial growth in rooftop solar adoption. Major population centers like Los Angeles, San Diego, and the San Francisco Bay Area have seen huge numbers of residential solar installations.
Oregon has over 3,000 megawatts of installed solar capacity, thanks in part to state renewable portfolio standards and solar incentives. Solar potential is highest in central and eastern Oregon. The city of Portland has emerged as a solar leader, with significant distributed generation capacity. Washington also has excellent solar potential, with over 3,000 megawatts of installed capacity. Generous state incentives in Washington have made it easier for homeowners and businesses to adopt solar power.
The Northeast
The Northeast region of the United States, comprising states like New York, Pennsylvania, New Jersey, and Connecticut, has moderate solar potential compared to the Southwest. However, solar energy is still a viable renewable energy option in this part of the country. According to a report by the Atlantic Energy Company, distributed solar power from rooftops, communities, commercial buildings and municipalities could grow to over 24,000 megawatts in the coming years in the Northeast [1]. The states with the most solar potential are:
New York – NY has average solar radiation levels of 4.0-4.5 kWh/m2/day. With high electricity rates, going solar can save homeowners 30-40% on their utility bills. The NY-Sun initiative aims to install 6 GW of solar capacity by 2023 [2].
Pennsylvania – PA has average solar radiation of 4.0-4.5 kWh/m2/day. Net metering and renewable energy credits make solar financially viable. In 2021, PA ranked #6 in the country for installed solar capacity.
New Jersey – With average solar radiation of 4.5 kWh/m2/day and high electricity rates, NJ residents can achieve payback on solar panels within 5-7 years. NJ aims to generate 50% of its energy from renewable sources by 2030.
Connecticut – CT has average solar radiation levels of 4.0-4.5 kWh/m2/day. Net metering, along with state and federal tax credits, make rooftop solar financially attractive with a payback period of 7-8 years [3]. In CT, rooftop solar can provide 90-100% of a home’s electricity.
The Midwest
The Midwest has significant solar potential due to its latitude and abundant open land. States like Ohio, Michigan, Illinois and Minnesota could generate a substantial portion of their electricity from solar power. According to CNET, the Midwest receives 4-5 kWh per square meter per day of solar irradiance on average. While less than the Southwest, this is still sufficient for cost-effective solar generation.
Ohio is ranked 16th nationally for solar potential. The state could feasibly generate over 27 gigawatts from solar, meeting over 25% of its electricity demand according to the National Renewable Energy Laboratory. Michigan also has strong solar resources, particularly in the southern half of the state. Michigan currently ranks 11th in the U.S. for installed solar capacity. The solar industry employs over 2,800 people in the state.
Illinois solar has grown rapidly in recent years due to favorable policies, now ranking 13th nationally in solar jobs with over 4,200 direct jobs. The state’s net metering policy has driven substantial behind-the-meter rooftop solar deployment. Minnesota has over 260 solar companies operating across the state, employing 4,300 solar workers as of 2021 according to SEIA. The state ranks 19th nationally in installed solar capacity.
Federal Solar Incentives
The federal government offers tax credits and other incentives to encourage homeowners to install solar PV systems. The most significant incentive is the federal solar Investment Tax Credit (ITC). The ITC allows homeowners to deduct 26% of the cost of installing a solar energy system from their federal taxes through 2032. For systems installed between 2020 and 2032, the ITC will be 26%.
The ITC applies to both residential and commercial solar installations. There is no cap on the amount that can be claimed. If the tax credit exceeds the amount of taxes owed, the excess credit can be carried forward to the following year. The credit can be claimed once the solar PV system is operational.
The ITC significantly reduces the upfront costs of installing solar panels. The Department of Energy estimates the ITC has helped the U.S. solar market grow by more than 10,000% since it was implemented in 2006 [1].
State Solar Incentives
A report titled “An economic impact analysis of state solar incentives for improving economic performance” examined state policies promoting solar energy deployment in the US. They found that many states offer incentives like rebates, tax credits, and performance-based incentives to support solar adoption. Some key state policies highlighted include:
California’s California Solar Initiative, which provided over $2.2 billion in incentives and helped install over 1,940 MW of solar capacity. The report found this incentivized $8.5 billion in total solar investment in the state.
New Jersey’s SREC program, which spurred over 1,700 MW of solar development through issuing solar renewable energy certificates. This helped make New Jersey 2nd in the nation for installed solar capacity.
Massachusetts’ SREC program, which supported over 1,000 MW of solar growth through tradable SRECs. The state also offers additional rebates and tax incentives.
New York’s NY-Sun Initiative, which commits over $1 billion through 2023 to solar incentives. This is projected to lead to 3,000 MW of installed capacity.
The report concluded that state policies like these have been critical for enabling the rapid growth of solar energy nationwide.
Source: https://research.polyu.edu.hk/en/publications/an-economic-impact-analysis-of-state-solar-incentives-for-improvi
Conclusion
In summary, the southwestern United States, especially the states of California, Arizona, Nevada, New Mexico, and Texas, have the greatest solar resource in the country. This region has high solar insolation levels, meaning a high rate of solar radiation reaching the ground, due to its sunny and arid climate. The Southwest enjoys over 300 days of sunshine per year and relatively low cloud cover and humidity. This makes it the optimal location in the U.S. to produce solar power efficiently and economically. Other regions, like the Southeast, West Coast, Northeast and Midwest have lower solar insolation levels in comparison, albeit still substantial solar resources that can be harnessed effectively. With federal and state incentives, solar power will continue to expand across all regions of the country.