What Is The Wind Power Curve?
A wind power curve shows the relationship between wind speed and the power output of a wind turbine. It provides a graphical representation of how much power a particular wind turbine model can generate at different wind speeds. Wind power curves are important indicators of a turbine’s performance and energy production capabilities.
Power curves allow wind project developers to estimate the annual energy production from a proposed wind farm based on historical wind speed data for the site. They are also used to compare different turbine models and select the most suitable option for a location. During turbine operations, comparing the measured power curve to the manufacturer’s specified power curve can reveal anomalies and faults.
This article provides an overview of wind power curves, including how they are measured, factors that impact them, how they are used for energy projections and turbine selection, and methods for monitoring power performance. Key sections will cover the typical shape of wind power curves, how to estimate annual energy production using a wind turbine’s power curve, considerations for choosing turbines based on power curves, and the importance of tracking power curves over a turbine’s lifetime.
What is a Power Curve?
A wind turbine power curve shows the relationship between the power output of a wind turbine and the wind speed. It illustrates how much electrical power a particular wind turbine model is expected to produce at different wind speeds.
The power curve shows the power output on the vertical (Y) axis and wind speed on the horizontal (X) axis. It provides a graphical representation of the turbine’s power performance.
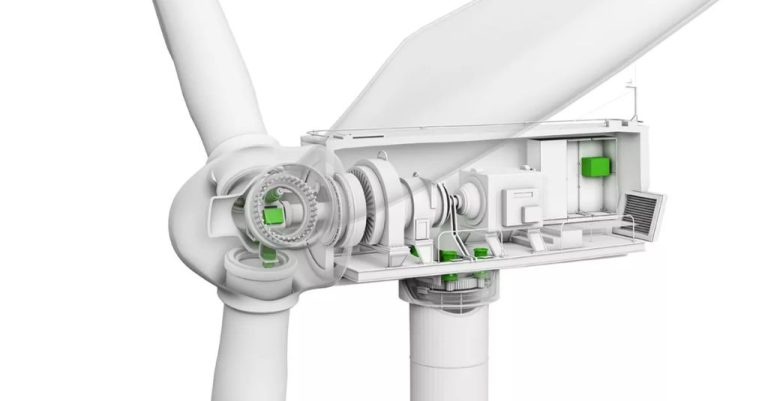
The power curve is unique to each wind turbine model. It differs from other performance curves like the thrust coefficient curve, which shows the thrust force exerted by the rotor over a range of wind speeds.
The power curve indicates the optimal wind speed range where the turbine operates most efficiently to maximize power production. It helps wind project developers select the most suitable turbine for a particular site based on the local wind resource and probable wind speeds.
Overall, the power curve demonstrates the real-world power producing capabilities of a wind turbine model across the full spectrum of wind speeds the turbine is designed to handle.
Sources: https://www.linkedin.com/pulse/offshore-wind-farm-investing-based-turbine-power-curves-rajput-zbeif,
https://www.inscc.utah.edu/~krueger/5270/guide-1.pdf
Methods to Measure Power Curves
There are three main methods used to measure wind turbine power curves: stationary tests, continuous tests, and hybrid tests. Stationary tests involve taking measurements at specific wind speeds by waiting for the wind to reach the desired speed. Continuous tests take measurements continuously across a range of wind speeds. Hybrid tests combine aspects of stationary and continuous methods.
The most common standard for power curve measurement is IEC 61400-12 published by the International Electrotechnical Commission. This standard defines requirements for anemometry equipment, data collection methods, analysis procedures and reporting. It aims to provide uniform testing methods for fair comparison between different wind turbines.
To carry out power curve measurements, meteorological masts equipped with calibrated anemometers, wind vanes, temperature and pressure sensors are installed at hub height upwind of the turbine. Data acquisition systems record the sensor measurements as well as turbine power output data. The wind speed, direction and air density data are correlated with the turbine power to generate the power curve. Careful alignment, calibration and data filtering help minimize errors.TheRoundup.org
Factors Impacting Power Curves
There are several factors that can impact the power curve measurements for a wind turbine, including:
Air density – Air density decreases with increasing altitude and temperature. Lower air density reduces the power output of a turbine. According to research by Pang (2021), air density is one of the most important environmental factors affecting wind power generation.
Turbulence – Turbulent airflow creates rapid variations in wind speed, which can reduce power output compared to smooth laminar airflow. Turbulence intensity is often expressed as a percentage of wind speed.
Wind shear – Vertical changes in wind speed also impact the power curve. Wind shear refers to the increase in wind speeds at greater heights. Wind shear exponent models this change.
Control settings – The pitch angle, rotational speed and other control settings on a turbine also influence power production at different wind speeds. These are optimized for maximum energy capture.
A turbine will have a unique power curve depending on the specific model and site conditions. According to research by El-Ahmar (2017), power curves are unique to a turbine and location. Variables like terrain and weather require adjusting the curve from initial estimates.
In summary, air density, turbulence, wind shear, and control settings all impact the measured power curve results for a wind turbine. Power curves are specific to a turbine model and location.
Sources:
Pang, C. (2021). Correlation analysis of factors affecting wind power based on Markov chain. IET Renewable Power Generation, 15(4), 705-713. https://ietresearch.onlinelibrary.wiley.com/doi/full/10.1049/esi2.12022
El-Ahmar, M. H., El-Sayed, A. S., & Algadi, M. (2017). Evaluation of factors affecting wind turbine output power. Presented at the 2017 Egyptian International Electrical Engineering Conference (EIEEC). International Conference on Electrical Engineering. doi:10.1109/eieec.2017.8052698
Uses of Power Curves
Power curves have several important uses in wind energy:
Estimate annual energy production – By analyzing the power curve, wind plant owners can estimate the total amount of energy a turbine will produce in a year for a given wind speed distribution. This helps determine the economic viability of a wind project.
Understand turbine performance – The power curve provides detailed performance data across all wind speeds. Any underperformance issues can be identified by comparing to the original power curve.
Validate power performance – Power curves are used to verify that turbines are meeting expected power output after installation. Performance validation is usually required to qualify for incentives.
Aid in turbine selection – Comparing power curves of different turbine models helps determine the optimal turbine for a wind site based on factors like cut-in speed, rated power, and annual energy production.
“Development of an Equivalent Wind Plant Power-Curve” (https://www.nrel.gov/docs/fy10osti/48146.pdf)
“Wind Turbine Power Curve – TheRoundup.org” (https://theroundup.org/wind-turbine-power-curve/)
Typical Shape of Curve
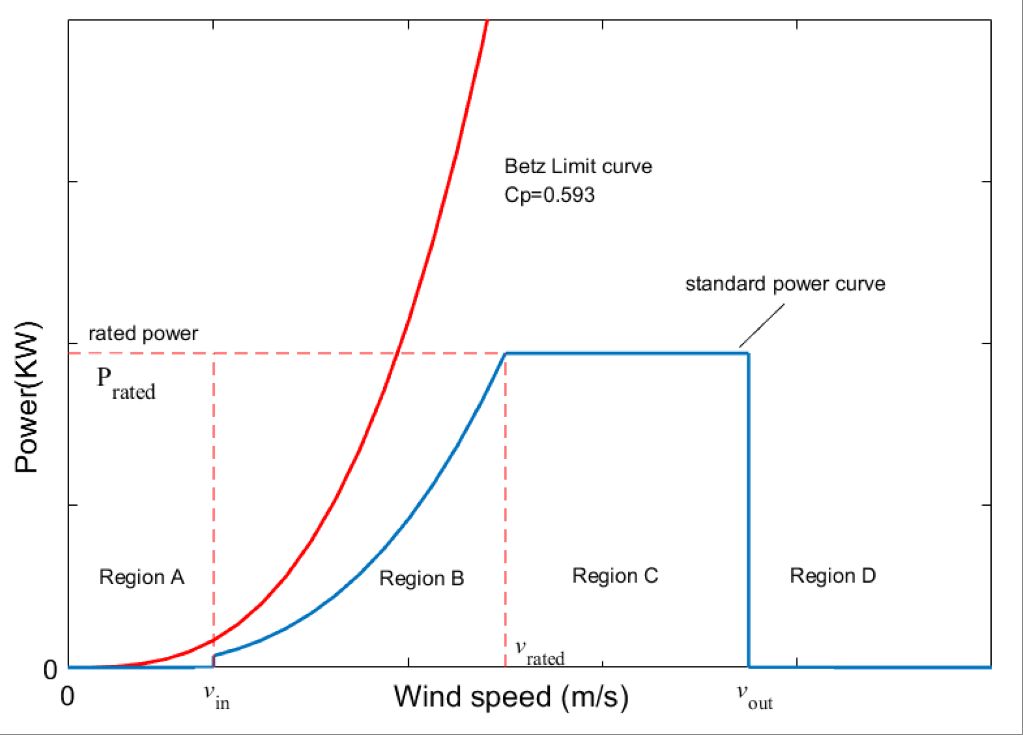
Wind turbine power curves typically have four distinct regions that demonstrate how the power output changes in relation to wind speed:
- Cut-in speed – The minimum wind speed required for the turbine to start generating power. Below this speed, the turbine does not produce power.
- Power ramp up – As wind speed increases above the cut-in speed, the power output ramps up rapidly and non-linearly.
- Rated power – At a certain high wind speed, the turbine reaches its maximum power output capacity. This is called the rated power.
- Cut-out speed – The maximum wind speed above which the turbine shuts down for safety. At very high wind speeds, the turbine stops generating power.
A typical wind turbine power curve graph highlights these four regions:
As seen in the graph, power output is zero below cut-in speed and above cut-out speed. It rises rapidly in the power ramp-up region, reaches a flat rated maximum power, and then drops to zero at the cut-out speed.
Estimating Energy Production
The power curve can be used along with wind speed data to estimate the annual energy production of a wind turbine or wind farm. This is done by calculating the expected power output across the range of wind speeds, and summing the energy production over a year.
The key calculation is to integrate the power curve with the wind speed frequency distribution at the site. The wind speed distribution provides the percentage of time the wind blows at each speed over a year. By combining this wind speed frequency data with the power curve, you can calculate the expected energy output for each wind speed range. This is then summed to determine the total annual energy production.
The capacity factor of a wind turbine or farm compares the actual energy production to the maximum possible output if the turbines were operating at full rated power all the time. It is calculated by taking the total annual energy production divided by the rated power multiplied by the number of hours in a year. Capacity factors for wind turbines typically range from 25-50%.
For example, a 2 MW turbine with a 35% capacity factor would produce 2 MW * 35% * 8760 hours = 6,132 MWh in a year.
Power Curves for Turbine Selection
Power curves are an important tool for comparing different wind turbine models during the turbine selection process. The power curve shows the relationship between wind speed and power output of a turbine. By analyzing power curves, wind farm developers can get key insights into a turbine’s performance.
Some key factors to compare between different power curves include:
- Cut-in wind speed – The minimum wind speed at which the turbine starts to generate power. A lower cut-in speed allows the turbine to operate more often.
- Rated power – The maximum power output achieved by the turbine. This indicates how much energy the turbine can potentially produce.
- Annual energy production – The estimated total annual energy output based on the power curve and wind resource data for the site. This estimates real-world energy production.
By overlaying power curves of different turbines, one can clearly visualize the differences in power output at various wind speeds. The turbine with the highest energy production may not necessarily have the highest rated power. Detailed analysis of the power curve is needed to select the optimal turbine for a site.
Other factors like cost, reliability, and manufacturer reputation will also affect turbine selection. But the power curve provides a standardized way of comparing turbine performance.
Power Curve Monitoring
One of the key applications of power curves is to monitor the operational performance of wind turbines over time. Power curve monitoring allows turbine owners to detect underperformance issues and test for degradation by comparing the measured power curve to the original power curve provided by the manufacturer. Some key aspects of power curve monitoring include:
Detecting underperformance – Power curve monitoring can reveal if a turbine is underperforming compared to expectations. This may occur due to factors like blade contamination, misaligned components, electrical issues, or control system problems. Unexpected drops in power output at certain wind speeds indicate issues to troubleshoot.
Testing for degradation over time – By periodically re-measuring the power curve after the turbine has been in operation for months or years, owners can quantify reductions in power output. This allows assessing the level of performance degradation over time.
Ensuring power curve matches manufacturer – When turbines are newly commissioned, the measured power curve should match the manufacturer’s certified power curve quite closely. Deviations may indicate a problem with turbine installation or calibration. Periodically verifying the match provides quality assurance.
Overall, routine power curve monitoring provides vital data to keep wind turbines operating at peak efficiency over their lifetime. Unexpected performance changes can be quickly identified and addressed to maximize productivity.
Sources:
https://www.papers.phmsociety.org/index.php/phmconf/article/download/2078/1082
https://wes.copernicus.org/articles/5/199/2020/
Conclusion
In summary, wind power curves are an important tool for understanding and optimizing wind turbine performance. They show the relationship between wind speed and power output, allowing operators to estimate annual energy production and select appropriate turbines for a site.
Power curves are shaped by the turbine’s design but can vary from predictions due to environmental factors and wear. By monitoring power curves over time, operators can identify issues and maintain optimal performance. Proper use of power curve data enables maximizing profitability of wind projects.
In this article, we covered key topics related to understanding wind power curves. These included defining what they are, how they are measured, their typical shape, and their uses for energy estimates, turbine selection, and performance monitoring. Power curves are a fundamental concept in wind energy with many applications.
By gaining a strong grasp of how to read and apply power curve data, wind professionals can make optimal decisions for their projects. Overall, they provide a window into a wind turbine’s expected performance over a range of wind speeds.