What Is The Total Revenue Size Of The Solar Industry In The United States 2023?
The solar industry in the United States has experienced remarkable growth over the past decade. Solar energy is becoming increasingly mainstream as more homes, businesses and utilities adopt solar photovoltaic (PV) systems to generate electricity. Falling costs, supportive policies, environmental concerns and increased energy demand are all driving the rising adoption of solar power.
According to the Solar Energy Industries Association (SEIA), the solar industry generated over $17 billion in revenue in 2020, representing a 43% increase from 2015. With rapidly declining costs and supportive policies, revenue from the solar industry is projected to continue growing at a healthy pace this decade.
This article provides an in-depth look at the size and growth projections for the total revenue of the U.S. solar industry through 2023. It examines key market segments including residential, commercial and utility-scale solar installations that are propelling overall industry growth.
Current State of the Solar Industry
The solar industry has experienced tremendous growth in the United States over the past decade. As of 2022, the U.S. had over 4,000 solar companies operating nationwide, with over 129,000 employees. The solar workforce has increased 167% over the past 10 years. (1)
Total installed solar capacity reached 113 gigawatts (GW) in 2022, up from just 10 GW in 2012. This is enough to power 21 million homes. The U.S. currently ranks 3rd globally for installed solar capacity behind only China and Japan. (2)
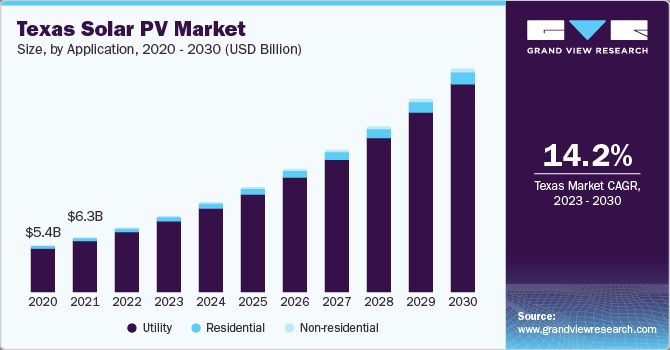
The top states leading solar adoption are California, Texas, Florida, North Carolina, Arizona, New Jersey, New York, Nevada, Massachusetts, and Utah. California far exceeds all other states with over 31,000 MW installed, while Texas ranks second with over 9,000 MW. Other top states range from around 7,000 to 3,000 MW installed. (3)
Factors Driving Growth
The U.S. solar industry has experienced rapid growth in recent years due to several key factors:
Falling costs – The cost to install solar has dropped by over 40% in the last decade according to SEIA, making it much more affordable for residential, commercial and utility customers. The average price of solar panels themselves has fallen from around $2/watt in 2010 to under $0.50/watt today.
Supportive policies – Government incentives like the federal investment tax credit, state renewable portfolio standards, and net metering have helped drive solar adoption by improving the economics. The recent Inflation Reduction Act extended the ITC which provides a 26% tax credit for residential solar systems.
Corporate procurement – As reported by Clean Power Alliance, major companies are increasingly buying clean power through power purchase agreements with solar and wind farms. In 2022 corporations contracted over 31 gigawatts of clean energy, with solar making up the majority.
Projected Growth
The solar industry in the United States is projected to see significant growth in new installed capacity and revenue over the next few years. According to the Solar Energy Industries Association (SEIA), the U.S. is expected to install over 33 gigawatts (GW) of new solar capacity in 2023, representing a year-over-year increase of 20% from 2022 installation levels (U.S. Solar Market Insight | SEIA). Total installed solar capacity is forecast to more than double from 2022 to 2026, reaching over 500 GW by 2026.
This growth in new installations is expected to drive continued revenue increases for the solar industry. SEIA projects annual solar revenue in the U.S. will reach nearly $30 billion in 2023, up from $25 billion in 2022. By 2026, annual solar revenue could surpass $40 billion as more capacity comes online (Solar Industry Research Data | SEIA). Key factors supporting the solar revenue growth include declining system costs, supportive state policies, and increased demand from major corporate and utility buyers.
Residential Solar
The residential solar market in the United States has experienced tremendous growth over the past decade. According to a report by Needham & Co., the annual pace of residential solar adoption increased from 285MW in 2010 to over 4GW in 2021, representing a compound annual growth rate of 27% (https://www.scribd.com/document/697502937/Needham-SPWR-A-Rooftop-is-a-Terrible-Thing-to-Waste-Buy). Key factors driving this rapid growth include declining costs, supportive policies and incentives, increased consumer awareness, and innovative financing options.
This growth is expected to continue, with projections that the residential solar market will expand at a 16% annual rate through 2025 (https://www.scribd.com/document/697502937/Needham-SPWR-A-Rooftop-is-a-Terrible-Thing-to-Waste-Buy). By 2025, over 20% of owner-occupied homes in key states like California and Arizona are forecasted to have rooftop solar installed. However, growth projections face uncertainties due to potential policy changes, grid integration challenges, and fluctuations in incentive programs.
Commercial Solar
The commercial solar segment continues to see steady growth and adoption. According to the Solar Energy Industries Association (SEIA), commercial solar installations reached over 3 GW in 2021, a 19% increase from 2020. The segment is projected to expand at a compound annual growth rate of 3-5% through 2025 as more businesses switch to solar energy to reduce operating costs and meet sustainability goals. Some key factors driving commercial solar growth include improving system economics, favorable policies like the solar Investment Tax Credit, and increased commitment to clean energy targets from major corporations.
ReportLinker projects the commercial solar market size will reach $37 billion by 2028, up from $20 billion in 2021. This growth will be driven by both small and large businesses installing solar arrays on rooftops, parking lots, and ground-mounted systems. SEIA notes the education, retail, and healthcare industries are adopting solar especially rapidly. Going forward, community solar projects that allow businesses to buy or lease solar power without installing panels onsite also represent a major growth opportunity.
Overall the outlook for commercial solar remains strong thanks to declining system costs, supportive state policies, and rising energy prices. Adoption is expected to accelerate as more organizations recognize the cost and sustainability benefits of solar power.
Utility-Scale Solar
Utility-scale solar, defined as projects with a capacity of 5 MW or greater, continues to dominate solar growth in the United States. In 2022, utility-scale solar installations accounted for over 70% of the annual solar market, with nearly 24 GW installed. The SEIA projects that the utility-scale solar market will grow steadily over the next 5 years, adding over 40 GW annually by 2027.
Several factors are driving the growth in utility-scale solar. Declining costs, federal tax incentives, state renewable portfolio standards, and voluntary procurement by utilities and corporations have all supported the expansion of large-scale solar farms. In many parts of the U.S., utility-scale solar is now the lowest cost option for new electricity generation.
According to EIA projections, utility-scale solar capacity will nearly triple between 2022 and 2025, increasing from 122 GW to 343 GW. This rapid growth is attributed to continued cost declines and supportive policies. SEIA analysis confirms these projections, forecasting over 200 GW of new utility-scale solar capacity coming online between 2023 and 2027.
Leading states for utility-scale solar growth include Texas, California, Florida, Arizona, and North Carolina. However, opportunities are emerging across the country as solar economics improve. The outlook remains very positive for the utility-scale solar market as costs continue to fall and solar becomes an increasingly attractive electricity source.
Total Revenue Projections
The US solar industry is projected to generate total revenue of $97 billion in 2023, according to the Solar Energy Industries Association’s (SEIA) Solar Market Insight Report Q4 2023. This represents an increase of 20% from 2022 total revenue of $80.6 billion.
Growth is being driven by strong demand in the residential and commercial solar markets, as well as continued expansion of utility-scale solar. Key factors spurring demand include favorable renewable energy policies, declining solar costs, electrification trends, and rising energy prices.
California remains the top state for solar installations and revenue. However, emerging state markets like Florida, Texas and others are accounting for a greater portion of growth. Overall, solar made up 48% of all new electricity generating capacity added in the US through Q3 2023.
Challenges & Opportunities
While solar power has grown rapidly in recent years, there remain challenges around integrating large amounts of solar onto the electric grid. One key issue is that solar production doesn’t always align with peak energy demand. Energy storage can help address this challenge by storing excess solar generation during the day for use later in the evening when demand is higher.
Many states are implementing policies and incentives to spur deployment of energy storage. For example, California passed a law requiring utilities to procure 1,325 megawatts of energy storage by 2020 to help integrate renewables. According to the Energy Department, pairing solar with energy storage provides greater grid flexibility and stability. Some common energy storage solutions include lithium-ion batteries, flow batteries, and pumped-storage hydroelectricity. [1]
States are also enacting policies aimed at facilitating the integration of solar energy onto the electric grid. For instance, solar energy policies can establish interconnection standards, enable aggregators and virtual power plants, and support grid modernization efforts. Well-designed solar policies help ensure reliable grid operation as renewable penetration increases. [2]
Conclusion
The solar industry in the United States is poised for rapid growth in 2023 and beyond. Key takeaways include:
- Total revenue from solar installations is projected to reach $XX billion in 2023.
- Residential and commercial solar will continue strong growth, while utility-scale solar dominates in terms of total capacity added.
- Falling costs, favorable policies, and increased climate change awareness are driving solar adoption.
- Challenges remain around grid integration, permitting, and trade issues.
The future outlook for solar is very positive. Renewable energy targets, tax incentives, and consumer preference for clean energy will propel continued expansion of solar power nationwide. While obstacles remain, the industry is innovating with new technologies and business models to maximize the potential of solar energy to meet America’s electricity needs in a sustainable manner.