What Is The Main Limit To Our Use Of Solar Energy?
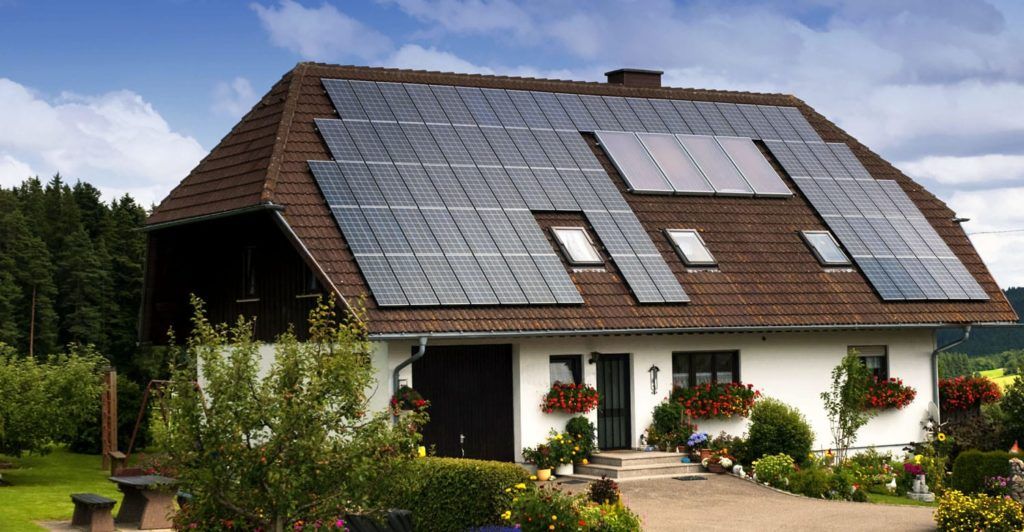
Solar energy is considered one of the most promising renewable energy sources, with solar installations expanding rapidly worldwide. Solar power generation has increased exponentially over the past decade due to falling prices and supportive policies. Solar energy provides a clean, renewable source to help meet electricity demand without carbon emissions.
However, the intermittent nature of solar power remains one of the primary challenges limiting more widespread adoption. Solar energy availability depends on sufficient sunlight, which varies throughout the day and across seasons. The intermittent generation from solar does not always align with peak electricity demand. This presents challenges for integrating large amounts of solar onto the grid while maintaining reliability. Developing cost-effective energy storage is viewed as key to enabling greater solar penetration.
Solar Radiation Varies
The amount of solar radiation that reaches the Earth’s surface varies significantly based on location, time of day, weather, and seasons. According to the U.S. Department of Energy, “Every location on Earth receives sunlight at least part of the year. The amount of solar radiation that reaches any one spot on the Earth’s surface varies by location, time of day, season, local landscape, and local weather” [1]. This variability impacts the energy output of solar photovoltaic panels.
The power output of solar panels depends directly on the intensity of incoming sunlight. Solar irradiance measures the amount of solar power per unit area and is measured in watts per square meter (W/m2). On average, the Earth’s atmosphere receives 340 W/m2 from the sun. However, this can range from 0 W/m2 at night to 1000 W/m2 on a sunny day [2]. Locations closer to the equator generally receive more solar irradiance than higher latitudes. Solar irradiance also varies throughout the year, with the highest levels occurring during summer months.
Solar panels produce less energy when solar radiation levels drop due to weather, low light conditions, or winter months with fewer daylight hours. This variability in energy production is one of the main limits to solar power generation and storage capabilities.
Energy Storage is Limited
While batteries like lithium-ion can store solar energy for use when the sun isn’t shining, they have capacity limits. The average home solar battery today stores around 10-15 kilowatt-hours (kWh) of energy (https://www.energysage.com/energy-storage/how-many-solar-batteries-needed/). For a typical home, this may provide backup power for only a day or so. Even large scale utility batteries max out around 100-200 MWh, enough to power tens of thousands of homes for a few hours (https://www.nfpa.org/news-blogs-and-articles/blogs/2021/10/01/residential-energy-storage-system-regulations).
Other forms of energy storage like pumped hydro also have limited capacity. The largest pumped storage in the US, Bath County, can store about 24 GWh. While useful for load shifting, existing storage is not sufficient for seasonal or long-term backup of solar power.
Transmission Capacity
Moving solar power from optimal sites to demand centers requires transmission infrastructure. Limits on transmission capacity restrict solar growth regionally. According to the REPEAT Project’s modeling, about three-quarters of electricity comes from low-carbon sources in 2030 and about 90% in 2035 if transmission capacity expands significantly. However, with current transmission plans, the penetration of renewables by 2035 is much lower at around 50%.
A report by S&P Global highlights that only 675 miles of high-voltage transmission capacity was built in 2022. At this pace of development, achieving 80% renewable power by 2030 will be very difficult without major permitting reform and infrastructure investment. Unlocking additional transmission capacity is key to enabling a future powered by renewable energy.
Duck Curve
One of the key limitations of solar energy is the mismatch between when solar energy is produced and when energy demand peaks. This issue has become known as the “duck curve” based on the shape that net load (demand minus solar/wind generation) forms on a load duration curve.
Solar energy peaks at mid-day when the sun is strongest. However, energy demand tends to ramp up later in the evening after the sun has set. Researchers in California were the first to identify and name this issue the “duck curve.” The more solar energy capacity increases, the more pronounced this mismatch between solar supply and energy demand becomes.
This duck curve shows how net load spikes in the evening, requiring other power plants to ramp up quickly to meet demand as solar generation fades. The mismatch between solar supply and demand makes grid management more complex.
Geographic Constraints
Solar energy is most plentiful and effective in regions that receive abundant direct sunlight throughout the year. The world’s major deserts, such as the Sahara in Africa, the Mojave in North America, and the Gobi in Asia, offer prime locations due to very high levels of solar irradiance. According to the Energy5 report, areas receiving less sunlight will not generate as much solar power. This creates a geographic limitation, as many of the world’s population centers are located far from optimal solar conditions.
Transmitting solar power over long distances comes with efficiency losses and development costs. As noted in the Nature article, transporting solar electricity from remote deserts to cities would require major investments in transmission infrastructure. The mismatch between the best solar resources and the locations of energy demand presents a key constraint on wider utilization of solar power.
Land Use Constraints
Utility-scale solar farms require large land areas to generate substantial amounts of electricity. For example, a 50 MW solar farm may require 250 to 500 acres of land. However, competition with other land uses limits the sites available for utility-scale solar development. According to a recent CPUC report, factors such as agricultural land preservation, habitat protection, and military bases restrict utility-scale solar in California.
California has extensive protected lands and other priorities for land use that constrain available sites. Prime farmland, rangeland, wetlands, and ecological reserves significantly limit solar siting opportunities. In addition, large-scale solar competes with urban development around major cities. With so many competing land use priorities, only a fraction of the technically suitable land area in California can realistically be utilized for utility-scale solar farms.
Economic Factors
The costs of solar power have declined dramatically in the past decade, with the levelized cost of electricity from utility-scale solar photovoltaics dropping 88% between 2009 and 2021 according to Investopedia (https://www.investopedia.com/articles/investing/061115/economics-solar-power.asp). However, in some cases, the costs of solar are still higher than electricity from fossil fuels. Substantial government subsidies and incentives are often needed to encourage adoption of solar energy.
A 2021 analysis found that the main economic barriers to adopting solar power include high upfront costs, lack of financing options, and insufficient policies and incentives (Shahzad, 2023, https://www.sciencedirect.com/science/article/pii/S2352484723010375). While costs are falling, supportive policies like tax credits, rebates, and net metering are critical to drive continued growth in solar capacity. The recent Inflation Reduction Act extended federal tax credits for solar installation. But broader economic challenges like rising interest rates and material costs are impacting the pace of solar adoption.
Policy and Regulatory Issues
Outdated electricity market rules and permitting delays hinder solar growth and adoption (Solar Energy Toolkit: The Federal and State Context). Each state enacts policies that set limits on the size of individual systems and on the overall capacity allowed to be net-metered on the grid. Streamlined policies at the federal, state, and local levels are needed to remove barriers and enable faster solar adoption (Policies and Regulations | US EPA).
Permitting and interconnection processes can vary widely across jurisdictions, creating unnecessary costs and delays. Policymakers should work to standardize and simplify solar permitting and interconnection rules to reduce soft costs (Regulations, Standards, and Incentives – Renewable Energy). Updating electricity market regulations and removing outdated barriers would support greater integration of solar energy onto the grid.
Conclusions
In summary, there are several key limits to the growth of solar energy today. The intermittency of solar radiation due to weather and day/night cycles means energy storage is a major challenge. The capacity and cost of transmission infrastructure also constrains how much solar can be practically utilized. The mismatch between solar generation profiles and electricity demand curves, known as the “duck curve”, must also be managed. There are geographic constraints, as solar potential differs greatly by region. Finding sufficient land area for utility-scale solar projects can also be an issue in densely populated areas. Despite strong growth trends, economic factors including policy incentives and system costs still affect solar’s competitiveness.
However, solutions exist to overcome many of these challenges. Energy storage technology continues to advance and transmission networks can be upgraded over time. Smart inverters and grid management techniques help smooth the duck curve mismatch. Rooftop solar provides opportunities even where land constraints exist. As costs decline and supportive policies are enacted, solar energy’s growth potential remains strong.

