How Do You Generate A Power Curve For A Wind Turbine?
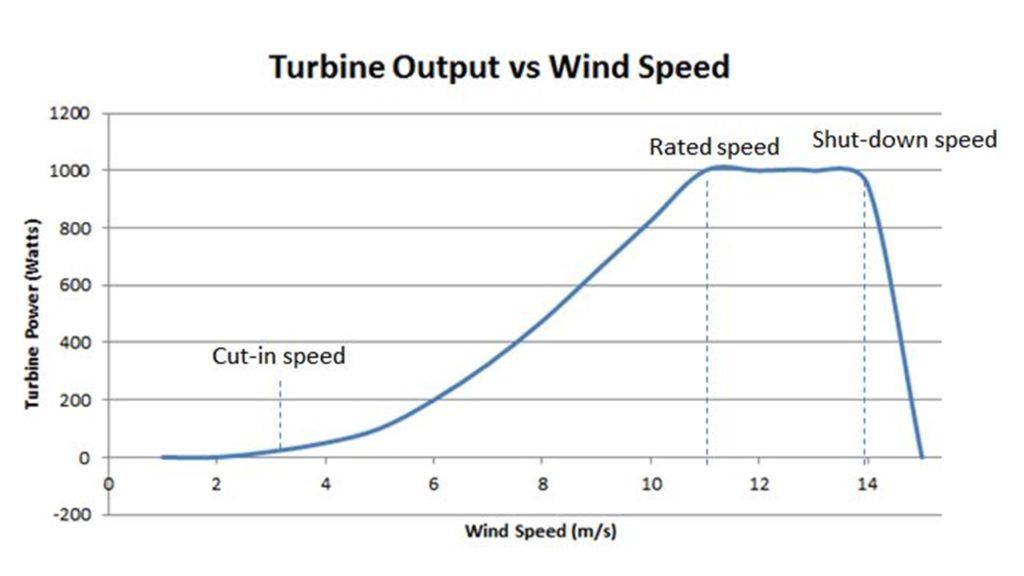
A power curve shows the relationship between wind speed and the power output of a wind turbine. It graphs how much electric power is produced at different wind speeds. The purpose of generating a power curve is to characterize the performance of a wind turbine and estimate its annual energy production (AEP) under the wind conditions at a particular site.
The process for creating a power curve involves collecting wind speed and power production data from the turbine, applying a curve fitting method to create the curve, evaluating uncertainty, and verifying the accuracy of the curve. This allows the performance of a turbine to be quantified and compared to its rated power and the power curves from other turbines. Knowing the power curve is critical for assessing the viability of a wind project.
Data Collection
Generating an accurate power curve for a wind turbine requires collecting both wind speed data and power output data from the turbine. The main types of data needed are:
- Wind speed data – This is typically collected using meteorological masts equipped with anemometers placed at hub height. Data should be collected across the full range of wind speeds the turbine will operate in.
- Power output data – This is collected directly from the turbine’s SCADA system in real time. Power output must be measured concurrently with the wind speed data.
It’s recommended to collect at least 1 year of concurrent data to account for seasonal variations. Some standards require as little as 3 months, while more data can improve accuracy. The data sampling rate is also important, with 1 Hz sampling ideal but 10 minute averages commonly used (Lee 2020).
Data Analysis
Analyzing and processing the raw data is crucial for generating an accurate power curve. This involves filtering the data to remove anomalies and outliers that can skew the curve. As noted in Dai (2022), data filtering algorithms help preprocess turbine data by removing erroneous and abnormal values.
Outliers in the data, caused by events like sensor malfunctions, can distort the power curve if included. Methods for detecting outliers include visual inspection, using statistical thresholds, and clustering algorithms (UtilitiesOne, 2023). Removing outliers improves curve accuracy.
The filtered data is then binned into wind speed ranges, usually 1 m/s wide. Binning condenses the data while retaining essential relationships between wind speed and power. Proper binning prevents overfitting the curve and enables uncertainty analysis of each bin (Wang et al., 2019). The binned data provides the basis for curve fitting.
Curve Fitting
Fitting a curve to binned power data is a critical step in generating an accurate power curve. The raw data needs to be aggregated into wind speed bins first. The width of the wind speed bins affects the variance in the data points. Wider bins reduce variability but can obscure changes in the curve shape. Narrower bins provide more detail but have higher variance. Typically, bin widths of 0.5-1 m/s are used as a compromise between detail and noise (see Approaches to wind power curve modeling).
Once the data is binned, different models can be fit to the points such as polynomial, logistic, spline, or segmented models. The choice depends on factors like the number of data points, whether there are gaps in the operating range, expected physical behavior, and desired smoothness. Polynomials are simple but can oscillate outside the data range. Logistic functions provide an s-shaped curve but may not fit well near cut-in and rated power. Splines and segmented models offer flexibility to fit different curve shapes in different wind speed ranges but can overfit if not regularized properly (see Wind power curve modeling).
Model fit can be evaluated using metrics like R-squared, root mean squared error (RMSE), Akaike information criterion (AIC), etc. R-squared indicates how much variance is explained but can’t identify overfitting. RMSE provides an absolute measure of error but depends on the scale. AIC accounts for both error and complexity to prevent overfitting. Cross-validation is also recommended by fitting the model to a subset of data and evaluating performance on the rest (see WindCurves package). The best model balances goodness of fit with complexity.
Uncertainty Analysis
Quantifying and propagating uncertainties is a critical step in generating an accurate power curve for a wind turbine. There are many sources of uncertainty that must be accounted for, including:
Wind speed measurement uncertainty – cup anemometers used to measure wind speed have inherent uncertainties typically around 2-3% (Simmons 2018 https://iopscience.iop.org/article/10.1088/1742-6596/1037/5/052028/pdf).
Turbine power measurement uncertainty – the electrical power output measurements also have uncertainties around 1-2%.
Air density uncertainty – changes in temperature, pressure and humidity affect air density and power generation.
These uncertainties must be propagated through the entire data analysis and power curve model fitting process to generate confidence intervals around the final power curve. Typical approaches involve Monte Carlo simulation where uncertainties are sampled from probability distributions and repeatedly propagated through the model to quantify the resulting uncertainty in power curve parameters.
By completing a rigorous uncertainty analysis, the final power curve model will come with confidence intervals that quantify the overall uncertainty. This allows users to understand the precision and potential errors associated with using the power curve for energy production estimates (Her 2018 https://ietresearch.onlinelibrary.wiley.com/doi/full/10.1049/iet-rpg.2017.0081).
Power Curve Verification
After generating the power curve from operational data, it is crucial to verify the curve by comparing it to the manufacturer’s guaranteed power curve over the turbine’s operating range. This step validates that the turbine is performing as expected across wind speeds. There are a few key aspects of verifying the power curve:
First, the generated and manufacturer curves should follow the same general shape, with power rising steeply at lower wind speeds, reaching a rated power plateau, then shutting off at high wind speeds. If the shapes diverge significantly, it indicates potential performance issues.
Second, the generated curve’s power output at each wind speed bin should be within about 5% of the manufacturer curve’s power. Larger discrepancies signify underperformance and warrant further investigation into the turbine’s condition.
Lastly, verify that the turbine operates across its full designed range. The generated curve should match the manufacturer curve at both cut-in and cut-out wind speeds. Deviation here shows the turbine is not transitioning between operating states as intended.
Careful power curve verification ensures the turbine is operating optimally and as guaranteed by the manufacturer. It provides quality assurance and identifies any tuning or maintenance needed to achieve maximum performance.
Using the Power Curve
The wind turbine power curve provides crucial data and insight for optimizing wind turbine performance and operations. Some key uses of the power curve include:
Input for energy production estimates – The power curve allows developers and operators to estimate the potential energy production of a wind turbine or wind farm based on the distribution of wind speeds at the site. By combining the power curve with wind resource data, annual energy production can be estimated fairly accurately. (Development of an Equivalent Wind Plant Power-Curve)
Identifying underperformance issues – Comparing the actual power output to the expected power curve output at a given wind speed allows operators to identify turbines that may be underperforming due to equipment faults, misconfiguration, or other issues. Significant deviations can trigger maintenance or troubleshooting activities. (Power curves for wind turbines)
Optimizing turbine operations – The power curve provides guidance on optimal tip speed ratios, blade pitch angles, and other operating parameters to maximize power output across different wind speeds. Operators can fine-tune control settings to optimize the turbines for the site-specific wind resource. (Power curves for wind turbines)
Regenerating the Power Curve
Power curves need periodic updating for a few reasons. As a wind turbine ages, the performance can degrade over time due to component wear. Additionally, improvements in measurement techniques may enable more accurate power curve generation. Environmental conditions like air density can also change over the turbine lifetime and impact the relationship between wind speed and power output.
The process for renewing an older power curve involves collecting new measurement data across a range of wind speeds. This requires metrological instrumentation like anemometers mounted on the turbine’s nacelle. The new datasets are then analyzed to derive an updated power curve following the curve fitting and uncertainty quantification processes. Periodic power curve regeneration is recommended by turbine manufacturers and owners to keep performance models accurate over the turbine lifetime of 20+ years.
Some examples of research on updating existing power curves include:
Innovative methods for wind turbine power curve upgrade using SCADA data
Wind Turbine Power Curve Upgrades: A Comprehensive Review
Alternative Methods
There are alternatives to using meteorological mast data for generating wind turbine power curves. These include using remote sensing technologies like Lidar and model-derived power curves based on simulations.
Lidar, which stands for light detection and ranging, is a remote sensing method that uses lasers to measure wind speed and direction. By mounting Lidar systems on the nacelle of a wind turbine, the wind speed approaching the rotor can be measured directly. This allows the turbine’s power curve to be derived without needing a met mast upwind of the turbine (Forget met masts. Let Lidar find a turbine’s power curve). The main advantages of Lidar are the ability to measure at hub height, lower costs compared to met masts, and no flow distortion. Limitations include higher uncertainty, the need for careful calibration, and some remaining flow distortion from the turbine itself.
Model-derived power curves rely on physics-based simulations to predict the power output of a turbine at different wind speeds. The aerodynamic properties of the rotor are modeled in detail and tuned based on limited real-world test data. Advantages are the low costs and ability to estimate power curves for new turbine designs. However, models have higher uncertainty compared to measurements and can miss real-world effects outside the scope of modeling (EirGrid’s met mast and alternatives study). Therefore, model-derived power curves alone are not as authoritative as mast measurements.
Conclusion
In summary, generating an accurate power curve for a wind turbine involves systematic data collection under a range of wind speeds, careful analysis and fitting of the power curve, quantification of uncertainties, and verification testing. The resulting power curve relates wind speed to power output and serves as a crucial benchmark for monitoring the turbine’s performance over time.
Having an accurate power curve is vital for optimizing wind turbine operations and detecting any degradation or faults. By comparing real-world power production to the reference curve, issues like blade soiling, wear and tear, and control errors can be identified and addressed. The power curve also informs economic analyses and power production forecasts. Overall, meticulous development and application of power curves allows wind farm owners to maximize returns on their investments.